Philips 2009 Annual Report Download - page 184
Download and view the complete annual report
Please find page 184 of the 2009 Philips annual report below. You can navigate through the pages in the report by either clicking on the pages listed below, or by using the keyword search tool below to find specific information within the annual report.-
 1
1 -
2
-
3
-
4
-
5
-
6
-
7
-
8
-
9
-
10
-
11
-
12
-
13
-
14
-
15
-
16
-
17
-
18
-
19
-
20
-
21
-
22
-
23
-
24
-
25
-
26
-
27
-
28
-
29
-
30
-
31
-
32
-
33
-
34
-
35
-
36
-
37
-
38
-
39
-
40
-
41
-
42
-
43
-
44
-
45
-
46
-
47
-
48
-
49
-
50
-
51
-
52
-
53
-
54
-
55
-
56
-
57
-
58
-
59
-
60
-
61
-
62
-
63
-
64
-
65
-
66
-
67
-
68
-
69
-
70
-
71
-
72
-
73
-
74
-
75
-
76
-
77
-
78
-
79
-
80
-
81
-
82
-
83
-
84
-
85
-
86
-
87
-
88
-
89
-
90
-
91
-
92
-
93
-
94
-
95
-
96
-
97
-
98
-
99
-
100
-
101
-
102
-
103
-
104
-
105
-
106
-
107
-
108
-
109
-
110
-
111
-
112
-
113
-
114
-
115
-
116
-
117
-
118
-
119
-
120
-
121
-
122
-
123
-
124
-
125
-
126
-
127
-
128
-
129
-
130
-
131
-
132
-
133
-
134
-
135
-
136
-
137
-
138
-
139
-
140
-
141
-
142
-
143
-
144
-
145
-
146
-
147
-
148
-
149
-
150
-
151
-
152
-
153
-
154
-
155
-
156
-
157
-
158
-
159
-
160
-
161
-
162
-
163
-
164
-
165
-
166
-
167
-
168
-
169
-
170
-
171
-
172
-
173
-
 174
174 -
 175
175 -
 176
176 -
 177
177 -
 178
178 -
 179
179 -
 180
180 -
 181
181 -
 182
182 -
 183
183 -
 184
184 -
 185
185 -
 186
186 -
 187
187 -
 188
188 -
 189
189 -
 190
190 -
 191
191 -
 192
192 -
 193
193 -
 194
194 -
195
-
196
-
197
-
198
-
199
-
200
-
201
-
202
-
203
-
204
-
205
-
206
-
207
-
208
-
209
-
210
-
211
-
212
-
213
-
214
-
215
-
216
-
217
-
218
-
219
-
220
-
221
-
222
-
223
-
224
-
225
-
226
-
227
-
228
-
229
-
230
-
231
-
232
-
233
-
234
-
235
-
236
-
237
-
238
-
239
-
240
-
241
-
242
-
243
-
244
 |
 |

significant influence with respect to these entities, the book value was
transferred from Investments in equity-accounted investees to Other
non-current financial assets effective January 1, 2009.
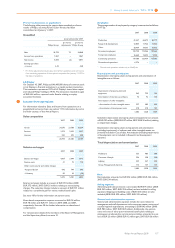
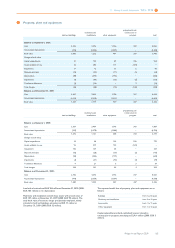
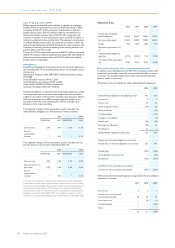
Investments in available-for-sale financial assets
The Company’s investments in available-for-sale financial assets consist
of investments in common stock of companies in various industries and
in the bond within the convertible bond issued by CBAY.
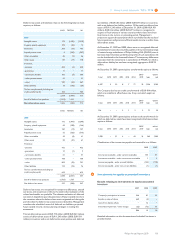
Main investments in available-for-sale financial assets consist of:
2008 2009
number of
shares carrying value
number of
shares carrying value
LG Display 47,225,000 558 − −
Pace Micro
Technology
Plc. 50,701,049 29 − −
NXP 854,313,000 255 854,313,000 207
TPO Displays 734,942,492 32 677,839,047 81
TCL
Corporation 162,855,739 27 162,855,739 85
TPV1) − 132 − −
CBAY1) − 51 − 61
952 434
1) TPV and CBAY are the underlying bonds within the convertible instruments
During 2009, Philips reduced its shareholding portfolio of available-for-
sale financial assets by selling its entire interest in LG Display and Pace
Micro Technology (Pace).
On March 11, 2009, Philips sold all shares of common stock in LG
Display to financial institutions in a capital market transaction. This
transaction represented 13.2% of LG Display’s issued share capital. The
transaction resulted in a gain of EUR 69 million, reported under
Financial income and expenses.
On April 17, 2009, Philips sold all shares of common stock in Pace Micro
Technology (Pace) to financial institutions in a capital market
transaction. The transaction resulted in a gain of EUR 48 million,
reported under Financial income and expenses.
The Company holds 19.8% of the common shares in NXP, representing
an amount of EUR 207 million. The interest in NXP resulted from the
sale of a majority stake in the Semiconductors division in September
2006. The Company’s stake in NXP is considered a non-core activity
that is available-for-sale. Although the ultimate method of disposal and
the precise market for non-listed shares are not clear, the disposal
could be effected, for example, by way of a private transaction to
strategic buyers or other financial parties, or via a public offering. The
Company does not have any definitive plans to dispose of this interest.
NXP is a privately-held company that is not quoted in an active market.
NXP is carried at cost because the fair value cannot be reliably
determined. The variability in the range of reasonable fair value
estimates is significant and the probabilities of the various estimates
within the range of reasonable inputs are not sufficiently reliable to
determine a fair value. This is mainly due to the limited visibility to the
financial projections for NXP, the impact that restructuring initiatives
and differing potential capital structure could have in relation to the
future financial performance of the company combined with the volatile
nature of the semiconductor industry.
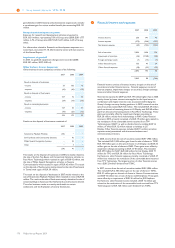
Triggered by the deteriorating economic environment of the
semiconductor industry in general and the financial performance of
NXP specifically, Philips performed impairment reviews on the carrying
value of the investment in NXP in 2008 and 2009. At the end of the first
quarter of 2009, impairment charges were recognized in the amount of
EUR 48 million (2008: EUR 599 million), which were reported in
Financial income and expenses.
If there is objective evidence that an impairment loss has been incurred
for an unquoted equity investment carried at cost, the amount of the
impairment loss is measured as the difference between the carrying
amount of the investment and the present value of the estimated
discounted future cash flows.
The discounted future cash flows have been estimated using various
valuation techniques including multiplier calculations (‘EBITDA
multiples’), calculations based on the share price performance of a peer
group of listed (semiconductor) companies and discounted cash-flow
models based on unobservable inputs. The latter methodology involved
estimates of revenues, expenses, capital spending and other costs, as
well as a discount rate calculated from the risk profile of the
semiconductor industry. Taking into account certain market
considerations and the range of estimated fair values, management
determined that the best estimate of future cash flows for the NXP
investment as per the end of the first quarter of 2009 was EUR 207
million. However, the resulting estimated discounted cash flow amount
used for impairment purposes represents an estimate; the actual cash
flows of this interest could materially differ from that estimate. Based
on the impairment reviews performed subsequent to the first quarter
we concluded that no further impairment was necessary.
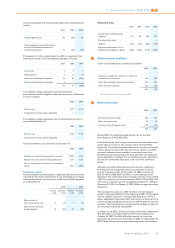
Loans and receivables
Loans and receivables mainly relate to restricted liquid assets.
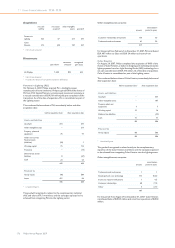
11 Non-current receivables
Non-current receivables include receivables with a remaining term of
more than one year, and the non-current portion of income taxes
receivable amounting to EUR 2 million (2008: EUR 1 million).
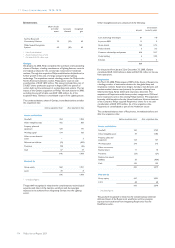
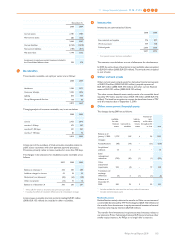
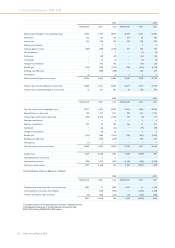
12 Other non-current assets
Other non-current assets in 2009 are comprised of prepaid pension
costs of EUR 1,518 million (2008: EUR 1,858 million) and prepaid
expenses of EUR 25 million (2008: EUR 48 million).
11 12 11 Group financial statements 11.12 - 11.12
184 Philips Annual Report 2009