Philips 2009 Annual Report Download - page 129
Download and view the complete annual report
Please find page 129 of the 2009 Philips annual report below. You can navigate through the pages in the report by either clicking on the pages listed below, or by using the keyword search tool below to find specific information within the annual report.-
 1
1 -
2
-
3
-
4
-
5
-
6
-
7
-
8
-
9
-
10
-
11
-
12
-
13
-
14
-
15
-
16
-
17
-
18
-
19
-
20
-
21
-
22
-
23
-
24
-
25
-
26
-
27
-
28
-
29
-
30
-
31
-
32
-
33
-
34
-
35
-
36
-
37
-
38
-
39
-
40
-
41
-
42
-
43
-
44
-
45
-
46
-
47
-
48
-
49
-
50
-
51
-
52
-
53
-
54
-
55
-
56
-
57
-
58
-
59
-
60
-
61
-
62
-
63
-
64
-
65
-
66
-
67
-
68
-
69
-
70
-
71
-
72
-
73
-
74
-
75
-
76
-
77
-
78
-
79
-
80
-
81
-
82
-
83
-
84
-
85
-
86
-
87
-
88
-
89
-
90
-
91
-
92
-
93
-
94
-
95
-
96
-
97
-
98
-
99
-
100
-
101
-
102
-
103
-
104
-
105
-
106
-
107
-
108
-
109
-
110
-
111
-
112
-
113
-
114
-
115
-
116
-
117
-
118
-
 119
119 -
 120
120 -
 121
121 -
 122
122 -
 123
123 -
 124
124 -
 125
125 -
 126
126 -
 127
127 -
 128
128 -
 129
129 -
 130
130 -
 131
131 -
 132
132 -
 133
133 -
 134
134 -
 135
135 -
 136
136 -
 137
137 -
 138
138 -
 139
139 -
140
-
141
-
142
-
143
-
144
-
145
-
146
-
147
-
148
-
149
-
150
-
151
-
152
-
153
-
154
-
155
-
156
-
157
-
158
-
159
-
160
-
161
-
162
-
163
-
164
-
165
-
166
-
167
-
168
-
169
-
170
-
171
-
172
-
173
-
174
-
175
-
176
-
177
-
178
-
179
-
180
-
181
-
182
-
183
-
184
-
185
-
186
-
187
-
188
-
189
-
190
-
191
-
192
-
193
-
194
-
195
-
196
-
197
-
198
-
199
-
200
-
201
-
202
-
203
-
204
-
205
-
206
-
207
-
208
-
209
-
210
-
211
-
212
-
213
-
214
-
215
-
216
-
217
-
218
-
219
-
220
-
221
-
222
-
223
-
224
-
225
-
226
-
227
-
228
-
229
-
230
-
231
-
232
-
233
-
234
-
235
-
236
-
237
-
238
-
239
-
240
-
241
-
242
-
243
-
244
 |
 |

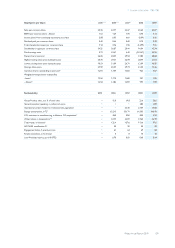
Key figures per share 20051,2,3) 20061,2,3) 20073) 2008 2009
Sales per common share 20.36 22.71 24.67 26.62 25.07
EBITA per common share - diluted 1.52 1.29 1.91 0.75 1.13
Income (loss) from continuing operations per share 2.88 0.85 4.61 (0.09) 0.46
Dividend paid per common share 0.40 0.44 0.60 0.70 0.70
Total shareholder return per common share 7.14 2.76 1.55 (14.99) 7.55
Stockholders’ equity per common share 14.25 20.87 20.41 16.84 15.74
Price/earnings ratio 9.11 33.61 6.40 (153.67) 44.96
Share price at year-end 26.25 28.57 29.52 13.83 20.68
Highest closing share price during the year 26.70 29.31 32.99 28.94 21.03
Lowest closing share price during the year 18.53 21.89 26.71 12.09 10.95
Average share price 21.59 26.57 29.73 21.42 15.26
Common shares outstanding at year-end5) 1,201 1,107 1,065 923 927
Weighted average shares outstanding
- basic5) 1,250 1,175 1,086 991 925
- diluted5) 1,253 1,184 1,099 997 929
Sustainability 2005 2006 2007 2008 2009
Green Product sales, as a % of total sales − 15.0 19.8 22.6 30.6
Green Innovation spending, in millions of euros − − − 282 409
Operational carbon footprint, in kilotons CO2-equivalent − − 2,135 2,139 1,920
Energy consumption, in TJ6) − 15,213 15,171 14,585 14,190
CO2 emissions in manufacturing, in kilotons CO2-equivalent6) − 869 856 825 814
Water intake, in thousands m3 6) − 4,171 4,209 3,962 4,219
Total waste, in kilotons6) − 125.4 127.6 113.6 97.6
ISO 14001 certification %6) − 92 90 95 92
Engagement Index, % positive score − 61 64 69 68
Female executives, in % of total − 6 8 10 10
Lost Workday Injuries, per 100 FTEs − 0.78 0.81 0.68 0.44
7 Investor information 7.8 - 7.8
Philips Annual Report 2009 129