Philips 2009 Annual Report Download - page 181
Download and view the complete annual report
Please find page 181 of the 2009 Philips annual report below. You can navigate through the pages in the report by either clicking on the pages listed below, or by using the keyword search tool below to find specific information within the annual report.-
 1
1 -
2
-
3
-
4
-
5
-
6
-
7
-
8
-
9
-
10
-
11
-
12
-
13
-
14
-
15
-
16
-
17
-
18
-
19
-
20
-
21
-
22
-
23
-
24
-
25
-
26
-
27
-
28
-
29
-
30
-
31
-
32
-
33
-
34
-
35
-
36
-
37
-
38
-
39
-
40
-
41
-
42
-
43
-
44
-
45
-
46
-
47
-
48
-
49
-
50
-
51
-
52
-
53
-
54
-
55
-
56
-
57
-
58
-
59
-
60
-
61
-
62
-
63
-
64
-
65
-
66
-
67
-
68
-
69
-
70
-
71
-
72
-
73
-
74
-
75
-
76
-
77
-
78
-
79
-
80
-
81
-
82
-
83
-
84
-
85
-
86
-
87
-
88
-
89
-
90
-
91
-
92
-
93
-
94
-
95
-
96
-
97
-
98
-
99
-
100
-
101
-
102
-
103
-
104
-
105
-
106
-
107
-
108
-
109
-
110
-
111
-
112
-
113
-
114
-
115
-
116
-
117
-
118
-
119
-
120
-
121
-
122
-
123
-
124
-
125
-
126
-
127
-
128
-
129
-
130
-
131
-
132
-
133
-
134
-
135
-
136
-
137
-
138
-
139
-
140
-
141
-
142
-
143
-
144
-
145
-
146
-
147
-
148
-
149
-
150
-
151
-
152
-
153
-
154
-
155
-
156
-
157
-
158
-
159
-
160
-
161
-
162
-
163
-
164
-
165
-
166
-
167
-
168
-
169
-
170
-
 171
171 -
 172
172 -
 173
173 -
 174
174 -
 175
175 -
 176
176 -
 177
177 -
 178
178 -
 179
179 -
 180
180 -
 181
181 -
 182
182 -
 183
183 -
 184
184 -
 185
185 -
 186
186 -
 187
187 -
 188
188 -
 189
189 -
 190
190 -
 191
191 -
192
-
193
-
194
-
195
-
196
-
197
-
198
-
199
-
200
-
201
-
202
-
203
-
204
-
205
-
206
-
207
-
208
-
209
-
210
-
211
-
212
-
213
-
214
-
215
-
216
-
217
-
218
-
219
-
220
-
221
-
222
-
223
-
224
-
225
-
226
-
227
-
228
-
229
-
230
-
231
-
232
-
233
-
234
-
235
-
236
-
237
-
238
-
239
-
240
-
241
-
242
-
243
-
244
 |
 |

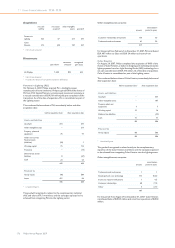
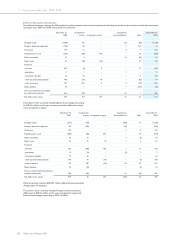
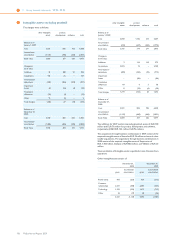
Deferred tax assets and liabilities relate to the following balance sheet
captions, as follows:
assets liabilities net
2009
Intangible assets 172 (1,390) (1,218)
Property, plant & equipment 109 (94) 15
Inventories 206 (13) 193
Prepaid pension costs 3 (390) (387)
Other receivables 45 (9) 36
Other assets 135 (17) 118
Provisions:
- pensions 452 (2) 450
- guarantees 11 − 11
- termination benefits 105 (5) 100
- other postretirement 91 − 91
- other 590 (23) 567
Other liabilities 73 (102) (29)
Tax loss carryforwards (including tax
credit carryforwards) 766 − 766
2,758 (2,045) 713
Set-off of deferred tax positions (1,515) 1,515 −
Net deferred tax assets 1,243 (530) 713
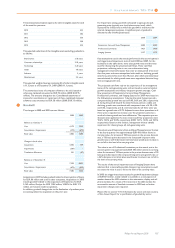
assets liabilities net
2008
Intangible assets 112 (1,410) (1,298)
Property, plant & equipment 62 (208) (146)
Inventories 160 (13) 147
Prepaid pension costs 52 (562) (510)
Other receivables 49 (8) 41
Other assets 82 (21) 61
Provisions:
- pensions 432 − 432
- guarantees 10 (1) 9
- termination benefits 61 − 61
- other postretirement 108 − 108
- other 803 (52) 751
Other liabilities 152 (76) 76
Tax loss carryforwards (including tax
credit carryforwards) 615 − 615
2,698 (2,351) 347
Set-off of deferred tax positions (1,767) 1,767 −
Net deferred tax assets 931 (584) 347
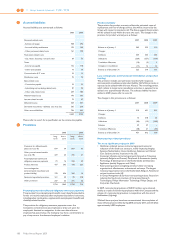
Deferred tax assets are recognized for temporary differences, unused
tax losses, and unused tax credits to the extent that realization of the
related tax benefits are probable. The ultimate realization of deferred
tax assets is dependent upon the generation of future taxable income in
the countries where the deferred tax assets originated and during the
periods when the deferred tax assets become deductible. Management
considers the scheduled reversal of deferred tax liabilities, projected
future taxable income, and tax planning strategies in making this
assessment.
The net deferred tax assets of EUR 713 million (2008: EUR 347 million)
consist of deferred tax assets of EUR 1,243 million (2008: EUR 931
million) in countries with a net deferred tax asset position and deferred
tax liabilities of EUR 530 million (2008: EUR 584 million) in countries
with a net deferred tax liability position. Of the total net deferred tax
assets of EUR 1,243 million at December 31, 2009, (2008: EUR 931
million), EUR 616 million (2008: EUR 291 million) is recognized in
respect of fiscal entities in various countries where there have been
fiscal losses in the current or preceding period. Management’s
projections support the assumption that it is probable that the results of
future operations will generate sufficient taxable income to utilize these
deferred tax assets.
At December 31, 2009 and 2008, there were no recognized deferred
tax liabilities for taxes that would be payable on the unremitted earnings
of certain foreign subsidiaries of Philips Holding USA (PHUSA) since it
has been determined that undistributed profits of such subsidiaries will
not be distributed in the foreseeable future. The temporary differences
associated with the investments in subsidiaries of PHUSA, for which a
deferred tax liability has not been recognized, aggregate to EUR 29
million.
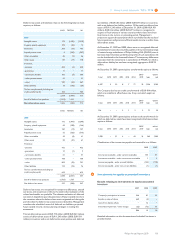
At December 31, 2009, operating loss carryforwards expire as follows:
Total 2010 2011 2012 2013 2014
2015/
2019 later
unlimi-
ted
4,437 3 39 8 7 71 30 1,096 3,183
The Company also has tax credit carryforwards of EUR 104 million,
which are available to offset future tax, if any, and which expire as
follows:
Total 2010 2011 2012 2013 2014
2015/
2019 later
unlimi-
ted
104 − − 2 1 2 3 71 25
At December 31, 2009, operating loss and tax credit carryforwards for
which no deferred tax assets have been recognized in the balance sheet,
expire as follows:
Total 2010 2011 2012 2013 2014
2015/
2019 later
unlimi-
ted
1,828 − 31 4 − 43 24 343 1,383
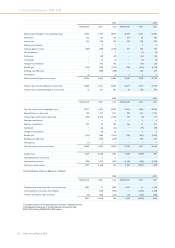
Classification of the income tax payable and receivable is as follows:
2008 2009
Income tax receivable - under current receivables 133 81
Income tax receivable - under non-current receivables 1 2
Income tax payable - under accrued liabilities (132) (118)
Income tax payable - under non-current liabilities (1) (1)
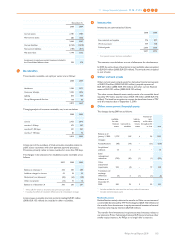
6Investments in equity-accounted investees
Results relating to investments in equity-accounted
investees
2007 2008 2009
Company’s participation in income 246 81 23
Results on sales of shares 660 (2) −
Gains from dilution effects − 12 −
Investment impairment / other charges (22) (72) 53
884 19 76
Detailed information on the aforementioned individual line items is
provided below.
11 Group financial statements 11.12 - 11.12 6
Philips Annual Report 2009 181