Philips 2009 Annual Report Download - page 206
Download and view the complete annual report
Please find page 206 of the 2009 Philips annual report below. You can navigate through the pages in the report by either clicking on the pages listed below, or by using the keyword search tool below to find specific information within the annual report.-
 1
1 -
2
-
3
-
4
-
5
-
6
-
7
-
8
-
9
-
10
-
11
-
12
-
13
-
14
-
15
-
16
-
17
-
18
-
19
-
20
-
21
-
22
-
23
-
24
-
25
-
26
-
27
-
28
-
29
-
30
-
31
-
32
-
33
-
34
-
35
-
36
-
37
-
38
-
39
-
40
-
41
-
42
-
43
-
44
-
45
-
46
-
47
-
48
-
49
-
50
-
51
-
52
-
53
-
54
-
55
-
56
-
57
-
58
-
59
-
60
-
61
-
62
-
63
-
64
-
65
-
66
-
67
-
68
-
69
-
70
-
71
-
72
-
73
-
74
-
75
-
76
-
77
-
78
-
79
-
80
-
81
-
82
-
83
-
84
-
85
-
86
-
87
-
88
-
89
-
90
-
91
-
92
-
93
-
94
-
95
-
96
-
97
-
98
-
99
-
100
-
101
-
102
-
103
-
104
-
105
-
106
-
107
-
108
-
109
-
110
-
111
-
112
-
113
-
114
-
115
-
116
-
117
-
118
-
119
-
120
-
121
-
122
-
123
-
124
-
125
-
126
-
127
-
128
-
129
-
130
-
131
-
132
-
133
-
134
-
135
-
136
-
137
-
138
-
139
-
140
-
141
-
142
-
143
-
144
-
145
-
146
-
147
-
148
-
149
-
150
-
151
-
152
-
153
-
154
-
155
-
156
-
157
-
158
-
159
-
160
-
161
-
162
-
163
-
164
-
165
-
166
-
167
-
168
-
169
-
170
-
171
-
172
-
173
-
174
-
175
-
176
-
177
-
178
-
179
-
180
-
181
-
182
-
183
-
184
-
185
-
186
-
187
-
188
-
189
-
190
-
191
-
192
-
193
-
194
-
195
-
 196
196 -
 197
197 -
 198
198 -
 199
199 -
 200
200 -
 201
201 -
 202
202 -
 203
203 -
 204
204 -
 205
205 -
 206
206 -
 207
207 -
 208
208 -
 209
209 -
 210
210 -
 211
211 -
 212
212 -
 213
213 -
 214
214 -
 215
215 -
 216
216 -
217
-
218
-
219
-
220
-
221
-
222
-
223
-
224
-
225
-
226
-
227
-
228
-
229
-
230
-
231
-
232
-
233
-
234
-
235
-
236
-
237
-
238
-
239
-
240
-
241
-
242
-
243
-
244
 |
 |

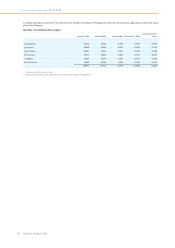
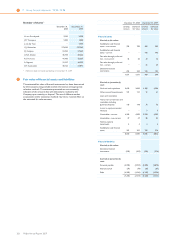
Number of shares1)
December 31,
2008
December 31,
2009
H. von Prondzynski 2,930 2,930
J.M. Thompson 1,000 1,000
J. van der Veer − 5,450
G.J. Kleisterlee 173,039 197,362
P-J. Sivignon 22,769 37,249
G.H.A. Dutiné 46,418 60,626
R.S. Provoost 41,495 55,537
A. Ragnetti 31,597 44,599
S.H. Rusckowski 40,125 54,893
1) Reference date for board membership is December 31, 2009
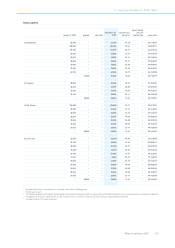
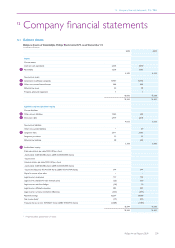
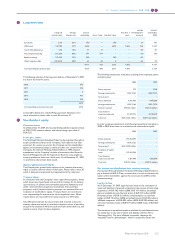
32 Fair value of financial assets and liabilities
The estimated fair value of financial instruments has been determined
by the Company using available market information and appropriate
valuation methods. The estimates presented are not necessarily
indicative of the amounts that will ultimately be realized by the
Company upon maturity or disposal. The use of different market
assumptions and/or estimation methods may have a material effect on
the estimated fair value amounts.
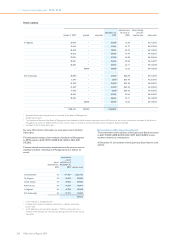
December 31, 2008 December 31, 2009
carrying
amount
estimated
fair value
carrying
amount
estimated
fair value
Financial assets
Carried at fair value:
Available-for-sale financial
assets - non-current 782 782 305 305
Available-for-sale financial
assets - current − − 145 145
Fair value through profit and
loss - non-current 36 36 32 32
Fair value through profit and
loss - current − − 25 25
Derivative financial
instruments 253 253 102 102
1,071 1,071 609 609
Carried at (amortized)
cost:
Cash and cash equivalents 3,620 3,620 4,386 4,386
Other current financial assets 121 121 21 21
Loans and receivables:
-Other non-current loans and
receivables including
guarantee deposits 118 118 76 76
-Loans to equity-accounted
investees − − 7 7
-Receivables - current 4,289 4,289 3,983 3,983
-Receivables - non-current 47 47 85 85
Held-to-maturity
investments 4 4 2 2
Available-for-sale financial
assets 391 391 276 276
8,590 8,590 8,836 8,836
Financial liabilities
Carried at fair value:
Derivative financial
instruments (505) (505) (276) (276)
Carried at (amortized)
cost:
Accounts payable (2,992) (2,992) (2,870) (2,870)
Interest accrual (79) (79) (87) (87)
Debt (4,188) (4,146) (4,267) (4,556)
(7,259) (7,217) (7,224) (7,513)
32 11 Group financial statements 11.12 - 11.12
206 Philips Annual Report 2009