Philips 2009 Annual Report Download - page 177
Download and view the complete annual report
Please find page 177 of the 2009 Philips annual report below. You can navigate through the pages in the report by either clicking on the pages listed below, or by using the keyword search tool below to find specific information within the annual report.-
 1
1 -
2
-
3
-
4
-
5
-
6
-
7
-
8
-
9
-
10
-
11
-
12
-
13
-
14
-
15
-
16
-
17
-
18
-
19
-
20
-
21
-
22
-
23
-
24
-
25
-
26
-
27
-
28
-
29
-
30
-
31
-
32
-
33
-
34
-
35
-
36
-
37
-
38
-
39
-
40
-
41
-
42
-
43
-
44
-
45
-
46
-
47
-
48
-
49
-
50
-
51
-
52
-
53
-
54
-
55
-
56
-
57
-
58
-
59
-
60
-
61
-
62
-
63
-
64
-
65
-
66
-
67
-
68
-
69
-
70
-
71
-
72
-
73
-
74
-
75
-
76
-
77
-
78
-
79
-
80
-
81
-
82
-
83
-
84
-
85
-
86
-
87
-
88
-
89
-
90
-
91
-
92
-
93
-
94
-
95
-
96
-
97
-
98
-
99
-
100
-
101
-
102
-
103
-
104
-
105
-
106
-
107
-
108
-
109
-
110
-
111
-
112
-
113
-
114
-
115
-
116
-
117
-
118
-
119
-
120
-
121
-
122
-
123
-
124
-
125
-
126
-
127
-
128
-
129
-
130
-
131
-
132
-
133
-
134
-
135
-
136
-
137
-
138
-
139
-
140
-
141
-
142
-
143
-
144
-
145
-
146
-
147
-
148
-
149
-
150
-
151
-
152
-
153
-
154
-
155
-
156
-
157
-
158
-
159
-
160
-
161
-
162
-
163
-
164
-
165
-
166
-
 167
167 -
 168
168 -
 169
169 -
 170
170 -
 171
171 -
 172
172 -
 173
173 -
 174
174 -
 175
175 -
 176
176 -
 177
177 -
 178
178 -
 179
179 -
 180
180 -
 181
181 -
 182
182 -
 183
183 -
 184
184 -
 185
185 -
 186
186 -
 187
187 -
188
-
189
-
190
-
191
-
192
-
193
-
194
-
195
-
196
-
197
-
198
-
199
-
200
-
201
-
202
-
203
-
204
-
205
-
206
-
207
-
208
-
209
-
210
-
211
-
212
-
213
-
214
-
215
-
216
-
217
-
218
-
219
-
220
-
221
-
222
-
223
-
224
-
225
-
226
-
227
-
228
-
229
-
230
-
231
-
232
-
233
-
234
-
235
-
236
-
237
-
238
-
239
-
240
-
241
-
242
-
243
-
244
 |
 |

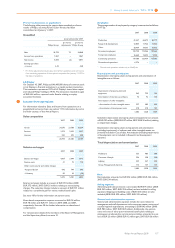
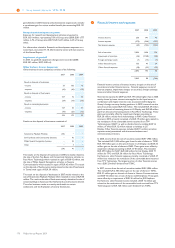
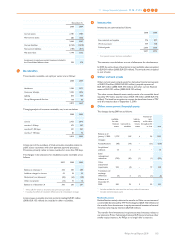
Pro forma disclosures on acquisitions
The following table presents the year-to-date unaudited pro-forma
results of Philips, assuming PLI and Color Kinetics had been
consolidated as of January 1, 2007:
Unaudited
January-December 2007
Philips Group
pro forma
adjustments1)
pro forma
Philips Group
Sales 26,793 75 26,868
Income from operations 1,867 − 1,867
Net income 4,873 (2) 4,871
Earnings per share
- in euros 4.49 4.48
1) Pro forma adjustments include sales, income from operations and net income
from continuing operations of the acquired companies from January 1, 2007 to
the date of acquisition.
LG Display
On October 10, 2007, Philips sold 46,400,000 shares of common stock
in LG Display to financial institutions in a capital markets transaction.
This transaction represented 13% of LG Display’s issued share capital
and reduced Philips’ holding to 19.9%. The transaction resulted in a gain
of EUR 654 million, reported under Results relating to equity-
accounted investees.
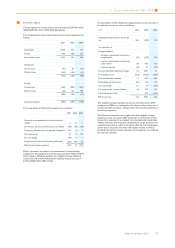
3Income from operations
For information related to Sales and Income from operations on a
geographical and sector basis, see section 11.10, Information by sector
and main country, of this Annual Report.
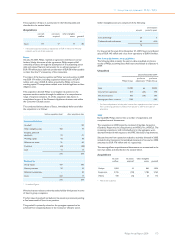
Sales composition
2007 2008 2009
Goods 24,270 23,568 20,254
Services 1,973 2,325 2,527
Licenses 550 492 408
26,793 26,385 23,189
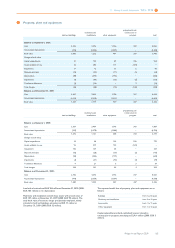
Salaries and wages
2007 2008 2009
Salaries and wages 4,607 5,094 5,075
Pension costs 41 75 110
Other social security and similar charges:
- Required by law 642 749 696
- Voluntary 89 63 (56)
5,379 5,981 5,825
Salaries and wages include an amount of EUR 318 million (2008:
EUR 372 million, 2007: EUR 35 million) relating to restructuring
charges. The voluntary charges include an amount of EUR 131 million
related to a curtailment gain for retiree medical benefit plan.
See note 18 for further information on pension costs.
Share-based compensation expense amounted to EUR 94 million,
EUR 78 million and EUR 111 million in 2009, 2008, and 2007,
respectively. See note 30 for further information on share-based
compensation.
For remuneration details of the members of the Board of Management
and the Supervisory Board, see note 31.
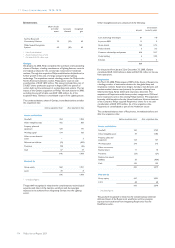
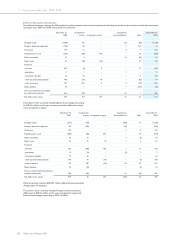
Employees
The average number of employees by category is summarized as follows
(in FTEs):
2007 2008 2009
Production 61,447 66,675 60,179
Research & development 12,804 11,926 11,563
Other 28,469 34,365 35,922
Permanent employees 102,720 112,966 107,664
Temporary employees 16,660 13,493 9,923
Continuing operations 119,380 126,459 117,587
Discontinued operations1) 6,276 − −
1) Discontinued operations relates only to MedQuist.
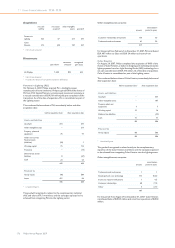
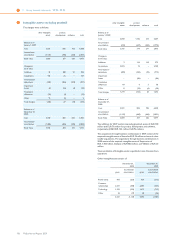
Depreciation and amortization
Depreciation of property, plant and equipment and amortization of
intangibles are as follows:
2007 2008 2009
Depreciation of property, plant and
equipment 562 729 746
Amortization of internal-use software 76 92 106
Amortization of other intangibles:
- Amortization of other intangible assets 227 389 436
- Amortization of development costs 218 318 181
1,083 1,528 1,469
Included in depreciation of property, plant and equipment is an amount
of EUR 121 million (2008: EUR 97 million, 2007: EUR 50 million) relating
to impairment charges.
Depreciation of property, plant and equipment and amortization
(including impairment) of software and other intangible assets are
primarily included in Cost of sales. Amortization (including impairment)
of development cost is included in Research and development
expenses.
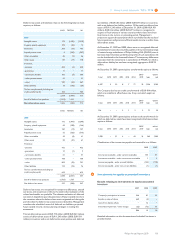
Total depreciation and amortization
2007 2008 2009
Healthcare 333 486 584
Consumer Lifestyle 296 358 248
Lighting 339 547 503
Group Management & Services 115 137 134
1,083 1,528 1,469
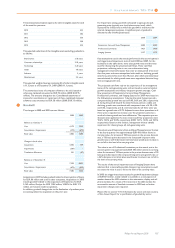
Rent
Rent expenses amounted to EUR 352 million (2008: EUR 322 million,
2007: EUR 334 million).
Selling expenses
Advertising and sales promotion costs totaled EUR 804 million (2008:
EUR 949 million, 2007: EUR 994 million) and are included in selling
expenses. Shipping and handling costs of EUR 505 million are also
included (2008: EUR 595 million, 2007: EUR 533 million).
General and administrative expenses
General and administrative expenses include the costs related to
management and staff departments in the corporate center, sectors and
country/regional organizations, amounting to EUR 842 million (2008:
EUR 983 million, 2007: EUR 869 million). Additionally, the pension
costs and costs of other post-retirement benefit plans relating to
employees, not allocated to current sector activities, amounted to a net
loss of EUR 23 million (2008: EUR 12 million gain, 2007: EUR 36 million
11 Group financial statements 11.12 - 11.12 3
Philips Annual Report 2009 177