Philips 2009 Annual Report Download - page 219
Download and view the complete annual report
Please find page 219 of the 2009 Philips annual report below. You can navigate through the pages in the report by either clicking on the pages listed below, or by using the keyword search tool below to find specific information within the annual report.-
 1
1 -
2
-
3
-
4
-
5
-
6
-
7
-
8
-
9
-
10
-
11
-
12
-
13
-
14
-
15
-
16
-
17
-
18
-
19
-
20
-
21
-
22
-
23
-
24
-
25
-
26
-
27
-
28
-
29
-
30
-
31
-
32
-
33
-
34
-
35
-
36
-
37
-
38
-
39
-
40
-
41
-
42
-
43
-
44
-
45
-
46
-
47
-
48
-
49
-
50
-
51
-
52
-
53
-
54
-
55
-
56
-
57
-
58
-
59
-
60
-
61
-
62
-
63
-
64
-
65
-
66
-
67
-
68
-
69
-
70
-
71
-
72
-
73
-
74
-
75
-
76
-
77
-
78
-
79
-
80
-
81
-
82
-
83
-
84
-
85
-
86
-
87
-
88
-
89
-
90
-
91
-
92
-
93
-
94
-
95
-
96
-
97
-
98
-
99
-
100
-
101
-
102
-
103
-
104
-
105
-
106
-
107
-
108
-
109
-
110
-
111
-
112
-
113
-
114
-
115
-
116
-
117
-
118
-
119
-
120
-
121
-
122
-
123
-
124
-
125
-
126
-
127
-
128
-
129
-
130
-
131
-
132
-
133
-
134
-
135
-
136
-
137
-
138
-
139
-
140
-
141
-
142
-
143
-
144
-
145
-
146
-
147
-
148
-
149
-
150
-
151
-
152
-
153
-
154
-
155
-
156
-
157
-
158
-
159
-
160
-
161
-
162
-
163
-
164
-
165
-
166
-
167
-
168
-
169
-
170
-
171
-
172
-
173
-
174
-
175
-
176
-
177
-
178
-
179
-
180
-
181
-
182
-
183
-
184
-
185
-
186
-
187
-
188
-
189
-
190
-
191
-
192
-
193
-
194
-
195
-
196
-
197
-
198
-
199
-
200
-
201
-
202
-
203
-
204
-
205
-
206
-
207
-
208
-
 209
209 -
 210
210 -
 211
211 -
 212
212 -
 213
213 -
 214
214 -
 215
215 -
 216
216 -
 217
217 -
 218
218 -
 219
219 -
 220
220 -
 221
221 -
 222
222 -
 223
223 -
 224
224 -
 225
225 -
 226
226 -
 227
227 -
 228
228 -
 229
229 -
230
-
231
-
232
-
233
-
234
-
235
-
236
-
237
-
238
-
239
-
240
-
241
-
242
-
243
-
244
 |
 |

logo in recognition of their low energy consumption in both standby
and on mode, the elimination of hazardous substances and the fact that
they have been designed for easy recycling.
Lighting
The new Novallure LED candle combines the advantages of LED
technology, particularly lower energy usage and longer lifetime, with
stylish design. It can save up to 80% over incandescent lamps while
providing similar light quality. What makes the Novallure candle so
special is the fusion of LED technology and its candle shape design, giving
it that classic look. It is ideal to be retrofitted in chandeliers and similar
light fixtures, where the Novallure candle will enhance the atmosphere
by producing a bright sparkling and ambient light effect. The Philips LED
candle, from the Novallure series, has been recognized by the Hong
Kong Designers Association with the silver HKDA Asia Design Award
09.
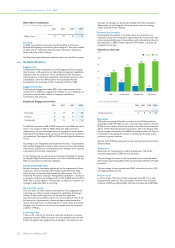
EcoVision4: Green Innovations
In 2009 Philips invested more than EUR 400 million in Green
Innovations – the R&D spend related to the development of new
generations of Green Products and Green Technologies.
Healthcare
Philips Healthcare invested some EUR 50 million, concentrating on
innovation projects that consider all of the Green Focal Areas and aim
to reduce total life cycle impact. In particular the sector focuses on
reducing energy consumption, weight and dose.
Consumer Lifestyle
In 2009 the Consumer Lifestyle sector invested about EUR 130 million
in Green Innovations, a significant increase compared with EUR 36
million invested in 2008. The sector is dedicated to developing new
Green Products with a sharp focus on further enhancing energy
efficiency and closing material loops, for example by using recycled
materials or offering better recyclability. As a result of these Green
Innovations, Green Products sales further increased and contributed to
about 23% of Consumer Lifestyle’s sales.
Lighting
The Lighting sector accounts for almost half of the total spend on Green
Innovations, with an investment of some EUR 185 million. In September
2009, Philips was the first to enter the US Department of Energy’s L-
Prize competition, which seeks an LED alternative to the common 60-
watt incandescent light bulb. Our innovation ranked 3rd in TIME
Magazine’s list of 50 best inventions of 2009 and shows our
commitment to the LED lighting revolution. Our focus continues to be
on developing new energy-efficient lighting solutions, further enhancing
current Green Products and realizing technological breakthroughs in
the area of solid-state lighting.
Research
Within Corporate Technologies, Philips Research invested about
EUR 44 million, spread over Green Innovation projects focused on
global challenges related to water, air, waste and energy. One example
in energy efficiency is a patented technology in the Philips Starsense
telemanagement system.
The Dutch Department of Public Works wanted to deploy dynamic
lighting in renewed stretches of highway. Dimming light can reduce
power consumption, without putting safety at risk. Their new,
permanent lighting can now be dimmed thanks to the Philips Starsense
telemanagement system. Tests have shown that 100% light during rush
hour and 20% during low traffic is sufficient for optimum safety in
combination with reduced energy consumption and it is easy on the
eyes.
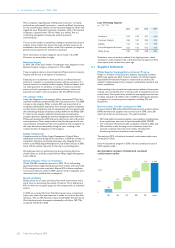
EcoVision4: Operational energy efficiency and carbon
footprint
During 2009 we continued to improve our data collection and analysis
process, further increasing data accuracy and relying less on estimates.
Moreover, to maintain comparability, we recalculated several figures
from 2007 and 2008 based on new insights. For instance, we increased
the number of non-industrial sites for which we collected actual data,
thereby reducing the estimated number. Additionally, data accuracy of
CO2 emissions of logistics – sea, road and air freight – has been greatly
improved, which also further decreases the amount of estimates.
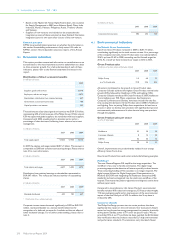
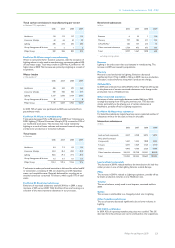
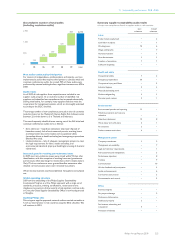
Our operational carbon footprint decreased 10% in 2009.
Operational carbon footprint
in kilotons CO2-equivalent
2007 2008 2009
Manufacturing 940 962 908
Non-industrial operations 200 199 176
Business travel 276 265 220
Distribution 719 713 616
Total Philips Group 2,135 2,139 1,920
Our total operational carbon footprint can also be expressed according
to the three scopes of the Greenhouse Gas Protocol.
Operational carbon footprint by Greenhouse Gas
Protocol scopes
in kilotons CO2-equivalent
2007 2008 2009
Scope 1 446 472 435
Scope 2 694 689 649
Scope 3 995 978 836
Total Philips Group 2,135 2,139 1,920
Operational energy efficiency and carbon footprint: 2009
details
The 2009 results can be attributed to several factors:
• Total CO2 emissions from manufacturing decreased 6% due to lower
production volumes as well as continued energy efficiency
improvement actions.
• CO2 emissions from non-industrial operations (offices, warehouses,
etc.), which represents 9% of the total, decreased 12%. Despite an
increase in the number of office buildings due to new acquisitions,
the amount of floor space remained virtually flat, as we continued to
centralize and re-allocate facilities. Energy consumption per square
meter decreased along with the lower number of employees.
• The total CO2 emissions related to business travel decreased 17%.
This significant reduction was achieved by promoting
videoconferencing in combination with our strict air travel policy.
CO2 emissions from lease cars decreased 8% compared with 2008
due to our green lease car policy.
• Overall CO2 emissions from logistics, representing approximately
one third of the total, decreased 14%. Sea freight fell 24% as a result
of lower volumes along with improved container utilization. The
same applied to road transport, which decreased 24% as well. CO2
emissions from air freight remained unchanged.
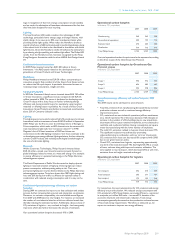
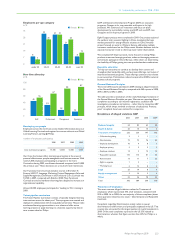
Operational carbon footprint for logistics
in kilotons CO2-equivalent
2007 2008 2009
Air transport 342 310 309
Road transport 205 211 161
Sea transport 172 192 146
Total Philips Group 719 713 616
For comparison, the most relevant ratios for CO2 emissions and energy
efficiency are provided below. We reduced energy consumption and
CO2 emissions by 10%. Nevertheless, our energy efficiency – expressed
in terajoules per million EUR sales – increased 2%, because of the
economic downturn and related sales reduction. Total energy
consumption generally decreases less than production volumes because
of base load energy requirements. Therefore, as sales pick up, we
expect to continue to improve our energy efficiency.
13 Sustainability performance 13.3 - 13.3
Philips Annual Report 2009 219