Philips 2009 Annual Report Download - page 187
Download and view the complete annual report
Please find page 187 of the 2009 Philips annual report below. You can navigate through the pages in the report by either clicking on the pages listed below, or by using the keyword search tool below to find specific information within the annual report.-
 1
1 -
2
-
3
-
4
-
5
-
6
-
7
-
8
-
9
-
10
-
11
-
12
-
13
-
14
-
15
-
16
-
17
-
18
-
19
-
20
-
21
-
22
-
23
-
24
-
25
-
26
-
27
-
28
-
29
-
30
-
31
-
32
-
33
-
34
-
35
-
36
-
37
-
38
-
39
-
40
-
41
-
42
-
43
-
44
-
45
-
46
-
47
-
48
-
49
-
50
-
51
-
52
-
53
-
54
-
55
-
56
-
57
-
58
-
59
-
60
-
61
-
62
-
63
-
64
-
65
-
66
-
67
-
68
-
69
-
70
-
71
-
72
-
73
-
74
-
75
-
76
-
77
-
78
-
79
-
80
-
81
-
82
-
83
-
84
-
85
-
86
-
87
-
88
-
89
-
90
-
91
-
92
-
93
-
94
-
95
-
96
-
97
-
98
-
99
-
100
-
101
-
102
-
103
-
104
-
105
-
106
-
107
-
108
-
109
-
110
-
111
-
112
-
113
-
114
-
115
-
116
-
117
-
118
-
119
-
120
-
121
-
122
-
123
-
124
-
125
-
126
-
127
-
128
-
129
-
130
-
131
-
132
-
133
-
134
-
135
-
136
-
137
-
138
-
139
-
140
-
141
-
142
-
143
-
144
-
145
-
146
-
147
-
148
-
149
-
150
-
151
-
152
-
153
-
154
-
155
-
156
-
157
-
158
-
159
-
160
-
161
-
162
-
163
-
164
-
165
-
166
-
167
-
168
-
169
-
170
-
171
-
172
-
173
-
174
-
175
-
176
-
 177
177 -
 178
178 -
 179
179 -
 180
180 -
 181
181 -
 182
182 -
 183
183 -
 184
184 -
 185
185 -
 186
186 -
 187
187 -
 188
188 -
 189
189 -
 190
190 -
 191
191 -
 192
192 -
 193
193 -
 194
194 -
 195
195 -
 196
196 -
 197
197 -
198
-
199
-
200
-
201
-
202
-
203
-
204
-
205
-
206
-
207
-
208
-
209
-
210
-
211
-
212
-
213
-
214
-
215
-
216
-
217
-
218
-
219
-
220
-
221
-
222
-
223
-
224
-
225
-
226
-
227
-
228
-
229
-
230
-
231
-
232
-
233
-
234
-
235
-
236
-
237
-
238
-
239
-
240
-
241
-
242
-
243
-
244
 |
 |

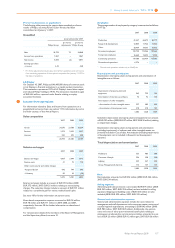
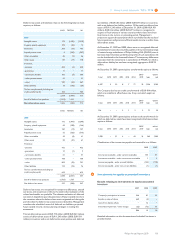
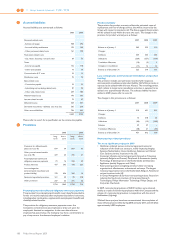
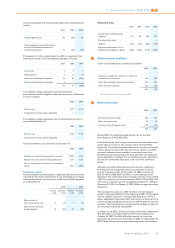
The estimated amortization expense for other intangible assets for each
of the next five years are:
2010 423
2011 382
2012 336
2013 308
2014 254
The expected useful lives of the intangible assets excluding goodwill are
as follows:
Brand names 2-20 years
Customer relationships 2-25 years
Technology 3-20 years
Other 1-8 years
Software 3 years
Development 3-5 years
The expected weighted average remaining life of other intangible assets
is 11.3 years as of December 31, 2009 (2008: 11.1 years).
The unamortized costs of computer software to be sold, leased or
otherwise marketed amounted to EUR 95 million (2008: EUR 95
million). The amounts charged to the Consolidated statements of
income for amortization or impairment of these capitalized computer
software costs amounted to EUR 38 million (2008: EUR 33 million).
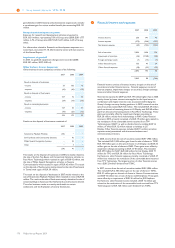
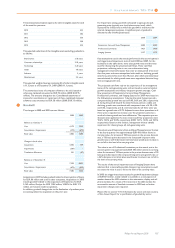
15 Goodwill
The changes in 2008 and 2009 were as follows:
2008 2009
Balance as of January 1:
Cost 4,173 7,952
Amortization / Impairments (373) (672)
Book value 3,800 7,280
Changes in book value:
Acquisitions 3,450 149
Impairments (301) −
Translation differences 331 (67)
Balance as of December 31:
Cost 7,952 8,021
Amortization / Impairments (672) (659)
Book value 7,280 7,362
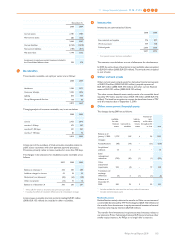
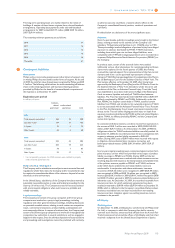
Acquisitions in 2009 include goodwill related to the acquisition of Saeco
for EUR 80 million and several other companies. Acquisitions in 2008
include goodwill related to the acquisitions of Respironics for EUR
2,162 million, Genlyte for EUR 1,024 million, VISICU for EUR 175
million, and several smaller acquisitions.
In addition, goodwill changed due to the finalization of purchase price
accounting related to acquisitions in the prior year.
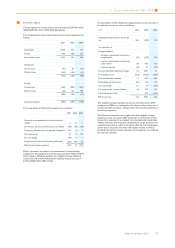
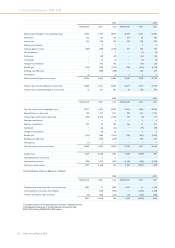
For Impairment testing, goodwill is allocated to (groups of) cash-
generating units (typically one level below sector level), which
represent the lowest level at which the goodwill is monitored for
internal management purposes. A significant part of goodwill is
allocated to the following businesses:
2008 2009
Respiratory Care and Sleep Management 2,380 2,345
Professional Luminaires 1,427 1,408
Imaging Systems 1,197 1,179
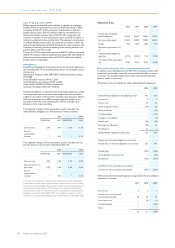
Key assumptions used in the annual (performed in the second quarter)
and trigger-based impairment tests of both 2008 and 2009, for the
businesses in the table above, were sales growth rates and the rates
used for discounting the projected cash flows. These cash flow
projections, reflecting value in use, were determined using
management’s internal forecasts that cover an initial period of no more
than five years and were extrapolated with stable or declining growth
rates for a period of no more than 10 years, after which a terminal value
was calculated, for which growth rates were capped at a historical long-
term average growth rate.
The projected cash flows rely on the experience of the management
teams of the cash-generating units and are based on external market
growth assumptions and industry long-term growth averages. Cash
flow projections of Respiratory Care and Sleep Management,
Professional Luminaires, and Imaging Systems for 2009 were based on
the following key assumptions: 1) during the initial forecast period a
compound sales growth was used of 9.4%, 8.0% and 3.8%, respectively;
2) during the period beyond the initial forecast period, a stable and
declining growth was considered with compound rates of 4.2%, 4.9%
and 3.0%, respectively; and 3) a terminal value for all three units was
based on a growth rate of 2.7%. Adjusted income from operations in all
three units is expected to increase over the projection period as a
result of volume growth and cost efficiencies. The respective pre-tax
discount rates applied to the most recent cash flow projections were
10.4%, 14.0%, and 10.0%, respectively (2008: 12.1%, 14.0%, and 10.5%,
respectively). Based on this analysis, management did not identify
impairment for these (groups of) cash-generating units.
The value in use of Respiratory Care and Sleep Management per the test
in the fourth quarter was approximately EUR 450 million above its
carrying value. An increase of 100 basis points in the pre-tax discount
rate, a 150 basis points decrease in the compound long-term sales
growth rate, or a 21% decrease in terminal value would cause its value in
use to fall to the level of its carrying value.
The value in use of Professional Luminaires per the annual test in the
second quarter was approximately EUR 350 million above its carrying
value. An increase of 120 basis points in the pre-tax discount rate, a 190
basis points decrease in the compound long-term sales growth rate, or
a 26% decrease in terminal value would cause its value in use to fall to
the level of its carrying value.
The results of the annual impairment test of Imaging Systems have
indicated that a reasonably possible change in key assumptions would
not cause the value in use to fall to the level of the carrying value.
In 2008, the trigger-based tests resulted in goodwill impairment charges
of EUR 301 million, mainly related to Lumileds as a consequence of
weaker demand for LED solutions in the automotive, display and cell
phone markets. As a result of the recovery in the LED market, the
recoverable amount of Lumileds increased in 2009 and no further
impairment charges were required.
Please refer to section 11.10, Information by sector and main country,
of this Annual Report for a specification of goodwill by sector.
11 Group financial statements 11.12 - 11.12 15
Philips Annual Report 2009 187