Philips 2009 Annual Report Download - page 236
Download and view the complete annual report
Please find page 236 of the 2009 Philips annual report below. You can navigate through the pages in the report by either clicking on the pages listed below, or by using the keyword search tool below to find specific information within the annual report.-
 1
1 -
2
-
3
-
4
-
5
-
6
-
7
-
8
-
9
-
10
-
11
-
12
-
13
-
14
-
15
-
16
-
17
-
18
-
19
-
20
-
21
-
22
-
23
-
24
-
25
-
26
-
27
-
28
-
29
-
30
-
31
-
32
-
33
-
34
-
35
-
36
-
37
-
38
-
39
-
40
-
41
-
42
-
43
-
44
-
45
-
46
-
47
-
48
-
49
-
50
-
51
-
52
-
53
-
54
-
55
-
56
-
57
-
58
-
59
-
60
-
61
-
62
-
63
-
64
-
65
-
66
-
67
-
68
-
69
-
70
-
71
-
72
-
73
-
74
-
75
-
76
-
77
-
78
-
79
-
80
-
81
-
82
-
83
-
84
-
85
-
86
-
87
-
88
-
89
-
90
-
91
-
92
-
93
-
94
-
95
-
96
-
97
-
98
-
99
-
100
-
101
-
102
-
103
-
104
-
105
-
106
-
107
-
108
-
109
-
110
-
111
-
112
-
113
-
114
-
115
-
116
-
117
-
118
-
119
-
120
-
121
-
122
-
123
-
124
-
125
-
126
-
127
-
128
-
129
-
130
-
131
-
132
-
133
-
134
-
135
-
136
-
137
-
138
-
139
-
140
-
141
-
142
-
143
-
144
-
145
-
146
-
147
-
148
-
149
-
150
-
151
-
152
-
153
-
154
-
155
-
156
-
157
-
158
-
159
-
160
-
161
-
162
-
163
-
164
-
165
-
166
-
167
-
168
-
169
-
170
-
171
-
172
-
173
-
174
-
175
-
176
-
177
-
178
-
179
-
180
-
181
-
182
-
183
-
184
-
185
-
186
-
187
-
188
-
189
-
190
-
191
-
192
-
193
-
194
-
195
-
196
-
197
-
198
-
199
-
200
-
201
-
202
-
203
-
204
-
205
-
206
-
207
-
208
-
209
-
210
-
211
-
212
-
213
-
214
-
215
-
216
-
217
-
218
-
219
-
220
-
221
-
222
-
223
-
224
-
225
-
 226
226 -
 227
227 -
 228
228 -
 229
229 -
 230
230 -
 231
231 -
 232
232 -
 233
233 -
 234
234 -
 235
235 -
 236
236 -
 237
237 -
 238
238 -
 239
239 -
 240
240 -
 241
241 -
 242
242 -
 243
243 -
 244
244
 |
 |

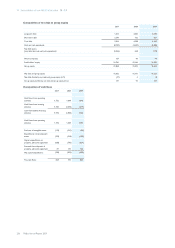
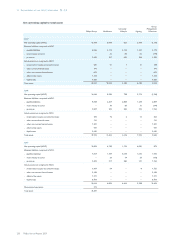
Composition of net debt to group equity
2007 2008 2009
Long-term debt 1,213 3,466 3,640
Short-term debt 2,350 722 627
Total debt 3,563 4,188 4,267
Cash and cash equivalents (8,769) (3,620) (4,386)
Net debt (cash)
(total debt less cash and cash equivalents) (5,206) 568 (119)
Minority interests 127 49 49
Stockholders’ equity 21,741 15,544 14,595
Group equity 21,868 15,593 14,644
Net debt and group equity 16,662 16,161 14,525
Net debt divided by net debt and group equity (in %) (31) 4 (1)
Group equity divided by net debt and group equity (in %) 131 96 101
Composition of cash flows
2007 2008 2009
Cash flows from operating
activities 1,752 1,648 1,545
Cash flows from investing
activities 3,700 (3,254) (219)
Cash flows before financing
activities 5,452 (1,606) 1,326
Cash flows from operating
activities 1,752 1,648 1,545
Purchase of intangible assets (118) (121) (96)
Expenditures on development
assets (233) (154) (188)
Capital expenditures on
property, plant and equipment (658) (770) (524)
Proceeds from disposals of
property, plant and equipment 81 170 126
Net capital expenditures (928) (875) (682)
Free cash flows 824 773 863
14 Reconciliation of non-GAAP information 14 - 14
236 Philips Annual Report 2009