Philips 2009 Annual Report Download - page 67
Download and view the complete annual report
Please find page 67 of the 2009 Philips annual report below. You can navigate through the pages in the report by either clicking on the pages listed below, or by using the keyword search tool below to find specific information within the annual report.-
 1
1 -
2
-
3
-
4
-
5
-
6
-
7
-
8
-
9
-
10
-
11
-
12
-
13
-
14
-
15
-
16
-
17
-
18
-
19
-
20
-
21
-
22
-
23
-
24
-
25
-
26
-
27
-
28
-
29
-
30
-
31
-
32
-
33
-
34
-
35
-
36
-
37
-
38
-
39
-
40
-
41
-
42
-
43
-
44
-
45
-
46
-
47
-
48
-
49
-
50
-
51
-
52
-
53
-
54
-
55
-
56
-
 57
57 -
 58
58 -
 59
59 -
 60
60 -
 61
61 -
 62
62 -
 63
63 -
 64
64 -
 65
65 -
 66
66 -
 67
67 -
 68
68 -
 69
69 -
 70
70 -
 71
71 -
 72
72 -
 73
73 -
 74
74 -
 75
75 -
 76
76 -
 77
77 -
78
-
79
-
80
-
81
-
82
-
83
-
84
-
85
-
86
-
87
-
88
-
89
-
90
-
91
-
92
-
93
-
94
-
95
-
96
-
97
-
98
-
99
-
100
-
101
-
102
-
103
-
104
-
105
-
106
-
107
-
108
-
109
-
110
-
111
-
112
-
113
-
114
-
115
-
116
-
117
-
118
-
119
-
120
-
121
-
122
-
123
-
124
-
125
-
126
-
127
-
128
-
129
-
130
-
131
-
132
-
133
-
134
-
135
-
136
-
137
-
138
-
139
-
140
-
141
-
142
-
143
-
144
-
145
-
146
-
147
-
148
-
149
-
150
-
151
-
152
-
153
-
154
-
155
-
156
-
157
-
158
-
159
-
160
-
161
-
162
-
163
-
164
-
165
-
166
-
167
-
168
-
169
-
170
-
171
-
172
-
173
-
174
-
175
-
176
-
177
-
178
-
179
-
180
-
181
-
182
-
183
-
184
-
185
-
186
-
187
-
188
-
189
-
190
-
191
-
192
-
193
-
194
-
195
-
196
-
197
-
198
-
199
-
200
-
201
-
202
-
203
-
204
-
205
-
206
-
207
-
208
-
209
-
210
-
211
-
212
-
213
-
214
-
215
-
216
-
217
-
218
-
219
-
220
-
221
-
222
-
223
-
224
-
225
-
226
-
227
-
228
-
229
-
230
-
231
-
232
-
233
-
234
-
235
-
236
-
237
-
238
-
239
-
240
-
241
-
242
-
243
-
244
 |
 |

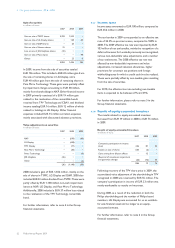
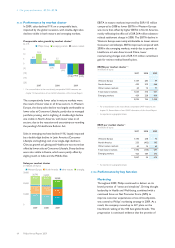
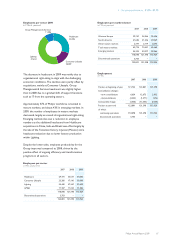
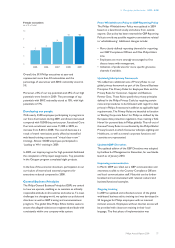
Employees per sector 2009
in FTEs at year-end
Healthcare
34,296
Consumer Lifestyle
18,389
Lighting
51,653
Group Management & Services
11,586
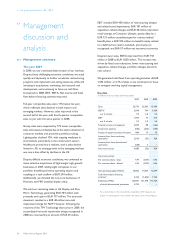
The decrease in headcount in 2009 was mainly due to
organizational right-sizing to align with the challenging
economic conditions. The declines were partly offset by
acquisitions, mainly at Consumer Lifestyle. Group
Management & Services headcount was slightly higher
than in 2008 due to a gradual shift of support functions
such as IT from the operating sectors.
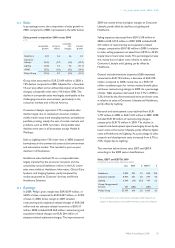
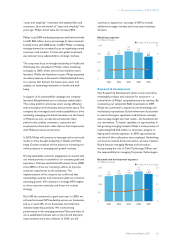
Approximately 57% of Philips’ workforce is located in
mature markets, and about 43% in emerging markets. In
2009, the number of employees in mature markets
decreased, largely as a result of organizational right-sizing.
Emerging markets also saw a reduction in employee
numbers as the additional headcount from Healthcare
acquisitions in China, India and Brazil was offset largely by
the sale of the Television factory in Juarez (Mexico) and a
headcount reduction due to lower factory production
within Lighting.
Despite the lower sales, employee productivity for the
Group improved compared to 2008, driven by the
positive effect of ongoing efficiency and transformation
programs in all sectors.
Employees per sector
in FTEs at year-end
2007 2008 2009
Healthcare 29,191 35,551 34,296
Consumer Lifestyle 23,280 17,145 18,389
Lighting 54,440 57,367 51,653
GM&S 11,187 11,335 11,586
118,098 121,398 115,924
Discontinued operations 5,703 − −
123,801 121,398 115,924
Employees per market cluster
in FTEs at year-end
2007 2008 2009
Western Europe 39,747 36,966 35,496
North America 21,682 31,336 27,069
Other mature markets 2,347 2,119 3,095
Total mature markets 63,776 70,421 65,660
Emerging markets 54,322 50,977 50,264
118,098 121,398 115,924
Discontinued operations 5,703 − −
123,801 121,398 115,924
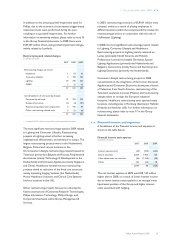
Employment
in FTEs
2007 2008 2009
Position at beginning of year 121,732 123,801 121,398
Consolidation changes:
- new consolidations 6,654 12,673 2,432
- deconsolidations (3,535) (1,571) (276)
Comparable change (1,050) (13,505) (7,630)
Position at year-end 123,801 121,398 115,924
of which:
continuing operations 118,098 121,398 115,924
discontinued operations 5,703 − −
4 Our group performance 4.1.15 - 4.1.15
Philips Annual Report 2009 67