Philips 2009 Annual Report Download - page 69
Download and view the complete annual report
Please find page 69 of the 2009 Philips annual report below. You can navigate through the pages in the report by either clicking on the pages listed below, or by using the keyword search tool below to find specific information within the annual report.-
 1
1 -
2
-
3
-
4
-
5
-
6
-
7
-
8
-
9
-
10
-
11
-
12
-
13
-
14
-
15
-
16
-
17
-
18
-
19
-
20
-
21
-
22
-
23
-
24
-
25
-
26
-
27
-
28
-
29
-
30
-
31
-
32
-
33
-
34
-
35
-
36
-
37
-
38
-
39
-
40
-
41
-
42
-
43
-
44
-
45
-
46
-
47
-
48
-
49
-
50
-
51
-
52
-
53
-
54
-
55
-
56
-
57
-
58
-
 59
59 -
 60
60 -
 61
61 -
 62
62 -
 63
63 -
 64
64 -
 65
65 -
 66
66 -
 67
67 -
 68
68 -
 69
69 -
 70
70 -
 71
71 -
 72
72 -
 73
73 -
 74
74 -
 75
75 -
 76
76 -
 77
77 -
 78
78 -
 79
79 -
80
-
81
-
82
-
83
-
84
-
85
-
86
-
87
-
88
-
89
-
90
-
91
-
92
-
93
-
94
-
95
-
96
-
97
-
98
-
99
-
100
-
101
-
102
-
103
-
104
-
105
-
106
-
107
-
108
-
109
-
110
-
111
-
112
-
113
-
114
-
115
-
116
-
117
-
118
-
119
-
120
-
121
-
122
-
123
-
124
-
125
-
126
-
127
-
128
-
129
-
130
-
131
-
132
-
133
-
134
-
135
-
136
-
137
-
138
-
139
-
140
-
141
-
142
-
143
-
144
-
145
-
146
-
147
-
148
-
149
-
150
-
151
-
152
-
153
-
154
-
155
-
156
-
157
-
158
-
159
-
160
-
161
-
162
-
163
-
164
-
165
-
166
-
167
-
168
-
169
-
170
-
171
-
172
-
173
-
174
-
175
-
176
-
177
-
178
-
179
-
180
-
181
-
182
-
183
-
184
-
185
-
186
-
187
-
188
-
189
-
190
-
191
-
192
-
193
-
194
-
195
-
196
-
197
-
198
-
199
-
200
-
201
-
202
-
203
-
204
-
205
-
206
-
207
-
208
-
209
-
210
-
211
-
212
-
213
-
214
-
215
-
216
-
217
-
218
-
219
-
220
-
221
-
222
-
223
-
224
-
225
-
226
-
227
-
228
-
229
-
230
-
231
-
232
-
233
-
234
-
235
-
236
-
237
-
238
-
239
-
240
-
241
-
242
-
243
-
244
 |
 |
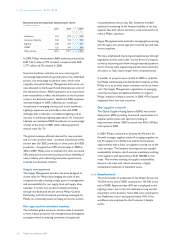
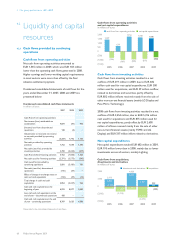
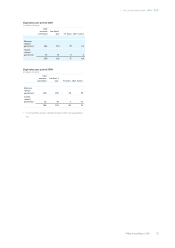
Acquisitions
In 2009, a total of EUR 300 million cash was used for
acquisitions, mainly for Saeco (EUR 171 million), Dynalite
(EUR 31 million) and Traxtal (EUR 18 million).
In 2008, a total of EUR 5,316 million cash was used for
acquisitions, mainly for Respironics (EUR 3,196 million),
Genlyte (EUR 1,894 million) and VISICU (EUR 198
million).
Divestments and derivatives
Cash proceeds of EUR 628 million and EUR 76 million
were received from the final sale of stakes in LG Display
and Pace Micro Technology respectively. Cash flows from
derivatives and securities led to a net cash outflow of
EUR 39 million.
In 2008, cash proceeds of EUR 1,831 million and EUR 37
million were received from the final sale of stakes in TSMC
and D&M Holdings respectively. Additionally, the sale of
shares in LG Display generated EUR 670 million cash.
Cash flows from derivatives led to a net cash inflow of
EUR 337 million.
Cash flows from financing activities
Net cash used for financing activities in 2009 was EUR 545
million. Philips’ shareholders were paid EUR 647 million in
the form of a dividend payment. The net impact of changes
in debt was an increase of EUR 60 million, including the
drawdown of a EUR 250 million loan, EUR 62
million increase from finance lease and bank loans, offset
by repayments on short-term debts and other long-term
debt amounting to EUR 252 million. Additionally, net cash
inflows for share delivery totaled EUR 29 million.
Net cash used for financing activities in 2008 was
EUR 3,575 million. The impact of changes in debt was an
increase of EUR 380 million, including the issuance of
EUR 2,053 million of bonds, offset by bond repayments
amounting to EUR 1,691 million. Also, Philips’
shareholders were paid EUR 720 million in the form of a
dividend payment. Additionally, net cash outflows for
share repurchases totaled EUR 3,257 million. This
included a total of EUR 3,298 million related to the
repurchases of shares for cancellation. The cash outflows
were partially offset by a net cash inflow of EUR 41 million
due to the exercise of stock options.
4.2.2 Cash flows from discontinued operations
In 2008, EUR 37 million cash was used by discontinued
operations, the majority of which related to tax payments
in connection with the 2006 sale of Philips’ majority stake
in the Semiconductors business.
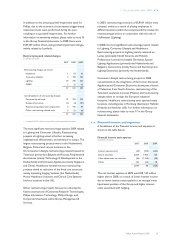
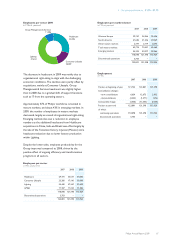
4.2.3 Financing
Consolidated balance sheet for the years 2009, 2008 and
2007 is presented below:
Condensed consolidated balance sheet information
in millions of euros
2007 2008 2009
Intangible assets 6,635 11,757 11,523
Property, plant and equipment 3,194 3,496 3,252
Inventories 3,213 3,491 2,913
Receivables 9,251 7,922 7,481
Accounts payable and other liabilities (7,817) (8,708) (8,636)
Provisions (3,055) (3,421) (2,980)
Other non-current financial assets 3,183 1,331 691
Equity-accounted investees 1,817 293 281
Assets of discontinued operations 319 − −
Liabilities of discontinued operations (78) − −
16,662 16,161 14,525
Cash and cash equivalents 8,769 3,620 4,386
Debt (3,563) (4,188) (4,267)
Net cash (debt) 5,206 (568) 119
Minority interests (127) (49) (49)
Stockholders’ equity (21,741) (15,544) (14,595)
(16,662) (16,161) (14,525)
Please refer to the consolidated balance sheets.
4.2.4 Cash and cash equivalents
In 2009, cash and cash equivalents increased by EUR 766
million to EUR 4,386 million at year-end. Cash inflow from
operations amounted to EUR 1,545 million, and there was
EUR 802 million proceeds from divestments including
EUR 718 million from the sale of stakes. This was partly
offset by an outflow of EUR 647 million related to the
annual dividend, EUR 300 million for acquisitions and small
unfavorable currency translation effects of EUR 15 million.
In 2008, cash and cash equivalents declined by EUR 5,149
million to EUR 3,620 million at year-end. The share
buyback program led to a cash outflow of EUR 3,298
million while a dividend of EUR 720 million was paid.
Furthermore, cash outflows for acquisitions were
EUR 5,316 million, partially compensated by EUR 2,600
million in cash proceeds from divestments. In addition,
cash flow from operations amounted to EUR 1,648
million, partly offset by unfavorable currency translation
effects within cash and cash equivalents of EUR 39 million.
4 Our group performance 4.2.1 - 4.2.4
Philips Annual Report 2009 69