Philips 2009 Annual Report Download - page 183
Download and view the complete annual report
Please find page 183 of the 2009 Philips annual report below. You can navigate through the pages in the report by either clicking on the pages listed below, or by using the keyword search tool below to find specific information within the annual report.-
 1
1 -
2
-
3
-
4
-
5
-
6
-
7
-
8
-
9
-
10
-
11
-
12
-
13
-
14
-
15
-
16
-
17
-
18
-
19
-
20
-
21
-
22
-
23
-
24
-
25
-
26
-
27
-
28
-
29
-
30
-
31
-
32
-
33
-
34
-
35
-
36
-
37
-
38
-
39
-
40
-
41
-
42
-
43
-
44
-
45
-
46
-
47
-
48
-
49
-
50
-
51
-
52
-
53
-
54
-
55
-
56
-
57
-
58
-
59
-
60
-
61
-
62
-
63
-
64
-
65
-
66
-
67
-
68
-
69
-
70
-
71
-
72
-
73
-
74
-
75
-
76
-
77
-
78
-
79
-
80
-
81
-
82
-
83
-
84
-
85
-
86
-
87
-
88
-
89
-
90
-
91
-
92
-
93
-
94
-
95
-
96
-
97
-
98
-
99
-
100
-
101
-
102
-
103
-
104
-
105
-
106
-
107
-
108
-
109
-
110
-
111
-
112
-
113
-
114
-
115
-
116
-
117
-
118
-
119
-
120
-
121
-
122
-
123
-
124
-
125
-
126
-
127
-
128
-
129
-
130
-
131
-
132
-
133
-
134
-
135
-
136
-
137
-
138
-
139
-
140
-
141
-
142
-
143
-
144
-
145
-
146
-
147
-
148
-
149
-
150
-
151
-
152
-
153
-
154
-
155
-
156
-
157
-
158
-
159
-
160
-
161
-
162
-
163
-
164
-
165
-
166
-
167
-
168
-
169
-
170
-
171
-
172
-
 173
173 -
 174
174 -
 175
175 -
 176
176 -
 177
177 -
 178
178 -
 179
179 -
 180
180 -
 181
181 -
 182
182 -
 183
183 -
 184
184 -
 185
185 -
 186
186 -
 187
187 -
 188
188 -
 189
189 -
 190
190 -
 191
191 -
 192
192 -
 193
193 -
194
-
195
-
196
-
197
-
198
-
199
-
200
-
201
-
202
-
203
-
204
-
205
-
206
-
207
-
208
-
209
-
210
-
211
-
212
-
213
-
214
-
215
-
216
-
217
-
218
-
219
-
220
-
221
-
222
-
223
-
224
-
225
-
226
-
227
-
228
-
229
-
230
-
231
-
232
-
233
-
234
-
235
-
236
-
237
-
238
-
239
-
240
-
241
-
242
-
243
-
244
 |
 |

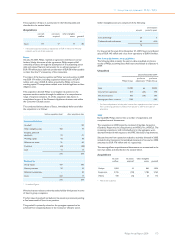
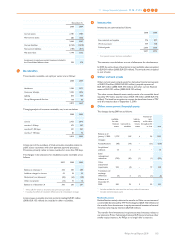
December 31,
2008 2009
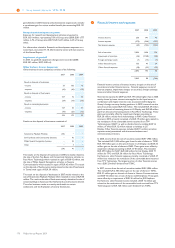
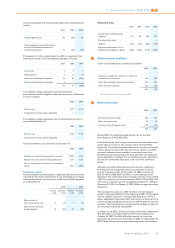
Current assets 2,781 1,987
Non-current assets 685 1,400
3,466 3,387
Current liabilities (2,134) (1,418)
Non-current liabilities (184) (817)
Net asset value 1,148 1,152
Investments in equity-accounted investees included in
the Consolidated balance sheet 293 274
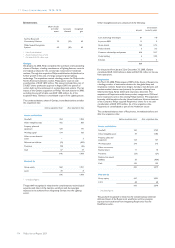
7Receivables
The accounts receivable, net, split per sector are as follows:
2008 2009
Healthcare 1,586 1,571
Consumer Lifestyle 1,235 1,096
Lighting 874 909
Group Management & Services 118 93
3,813 3,669
The aging analysis of accounts receivable, net, is set out below:
2008 2009
current 2,953 3,075
overdue 1-30 days 479 307
overdue 31-180 days 321 241
overdue > 180 days 60 46
3,813 3,669
A large part of the overdues of trade accounts receivable relates to
public sector customers with slow payment approval processes.
Provisions primarily relate to items overdue for more than 180 days.
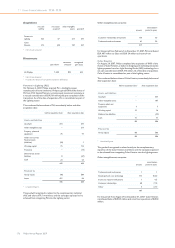
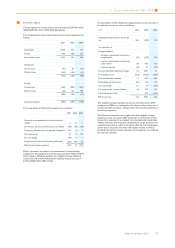
The changes in the allowance for doubtful accounts receivable are as
follows:
2007 2008 2009
Balance as of January 1 336 300 280
Additions charged to income 62 33 23
Deductions from allowance1) (85) (63) (58)
Other movements2) (13) 10 16
Balance as of December 31 300 280 261
1) Write-offs for which an allowance was previously provided
2) Including the effect of translation differences and consolidation changes
Income taxes receivable (current portion) totaling EUR 81 million
(2008: EUR 133 million) are included in other receivables.
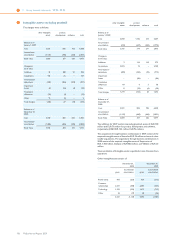
8Inventories
Inventories are summarized as follows:
2008 2009
Raw materials and supplies 976 871
Work in process1) 449 408
Finished goods 2,066 1,634
3,491 2,913
1) Prior period amount has been reclassified
The amounts recorded above are net of allowances for obsolescence.
In 2009, the write-down of inventories to net realizable value amounted
to EUR 219 million (2008: EUR 259 million). The write-down is included
in cost of sales.
9Other current assets
Other current assets include assets for derivative financial instruments
of EUR 102 million (2008: EUR 253 million), prepaid expenses of
EUR 334 million (2008: EUR 375 million) and other current financial
assets of EUR 191 million (2008: EUR 121 million).
The other current financial assets mainly consist of a convertible bond
issued by TPV with a total fair value of EUR 170 million (2008: EUR 142
million). The bond has an option to convert the bond into shares of TPV
until the maturity date of September 5, 2010.
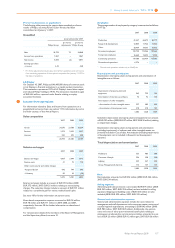
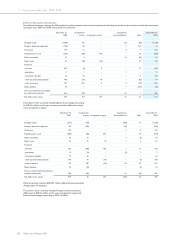
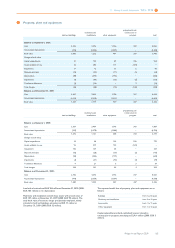
10 Other non-current financial assets
The changes during 2009 are as follows:
available-
for-sale
financial
assets
loans and re-
ceivables
held-to-
maturity
invest-
ments
financial as-
sets
at fair value
through profit
or loss total
Balance as of
January 1, 2009 1,1731) 1182) 4 36 1,331
Changes:
Reclassifications (98) (19) − (21) (138)
Acquisitions/
additions 13 5 − − 18
Sales/
redemptions/
reductions (720) (30) (1) (1) (752)
Value
adjustments/
impairments 222 (3) − 19 238
Translation and
exchange
differences (9) 5 (1) (1) (6)
Balance as of
December 31,
2009 581 76 2 32 691
1) Includes available-for-sale securities and cost-method investments
2) Includes restricted liquid assets
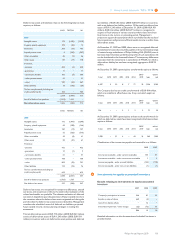
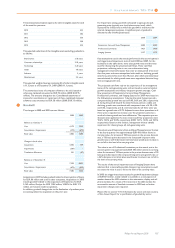
Reclassifications
Reclassifications mainly relate to the transfer to Other current assets of
a convertible bond issued by TPV Technology Ltd (EUR 162 million) and
the transfer from Investments in equity-accounted investees of several
minority-owned equity interests (EUR 28 million).
The transfer from Investments in equity-accounted investees relates to
our interest in Prime Technology Ventures III (Prime) and various other
smaller equity interests. As Philips is no longer able to exercise
11 Group financial statements 11.12 - 11.12 7 8 9 10
Philips Annual Report 2009 183