Philips 2009 Annual Report Download - page 62
Download and view the complete annual report
Please find page 62 of the 2009 Philips annual report below. You can navigate through the pages in the report by either clicking on the pages listed below, or by using the keyword search tool below to find specific information within the annual report.-
 1
1 -
2
-
3
-
4
-
5
-
6
-
7
-
8
-
9
-
10
-
11
-
12
-
13
-
14
-
15
-
16
-
17
-
18
-
19
-
20
-
21
-
22
-
23
-
24
-
25
-
26
-
27
-
28
-
29
-
30
-
31
-
32
-
33
-
34
-
35
-
36
-
37
-
38
-
39
-
40
-
41
-
42
-
43
-
44
-
45
-
46
-
47
-
48
-
49
-
50
-
51
-
 52
52 -
 53
53 -
 54
54 -
 55
55 -
 56
56 -
 57
57 -
 58
58 -
 59
59 -
 60
60 -
 61
61 -
 62
62 -
 63
63 -
 64
64 -
 65
65 -
 66
66 -
 67
67 -
 68
68 -
 69
69 -
 70
70 -
 71
71 -
 72
72 -
73
-
74
-
75
-
76
-
77
-
78
-
79
-
80
-
81
-
82
-
83
-
84
-
85
-
86
-
87
-
88
-
89
-
90
-
91
-
92
-
93
-
94
-
95
-
96
-
97
-
98
-
99
-
100
-
101
-
102
-
103
-
104
-
105
-
106
-
107
-
108
-
109
-
110
-
111
-
112
-
113
-
114
-
115
-
116
-
117
-
118
-
119
-
120
-
121
-
122
-
123
-
124
-
125
-
126
-
127
-
128
-
129
-
130
-
131
-
132
-
133
-
134
-
135
-
136
-
137
-
138
-
139
-
140
-
141
-
142
-
143
-
144
-
145
-
146
-
147
-
148
-
149
-
150
-
151
-
152
-
153
-
154
-
155
-
156
-
157
-
158
-
159
-
160
-
161
-
162
-
163
-
164
-
165
-
166
-
167
-
168
-
169
-
170
-
171
-
172
-
173
-
174
-
175
-
176
-
177
-
178
-
179
-
180
-
181
-
182
-
183
-
184
-
185
-
186
-
187
-
188
-
189
-
190
-
191
-
192
-
193
-
194
-
195
-
196
-
197
-
198
-
199
-
200
-
201
-
202
-
203
-
204
-
205
-
206
-
207
-
208
-
209
-
210
-
211
-
212
-
213
-
214
-
215
-
216
-
217
-
218
-
219
-
220
-
221
-
222
-
223
-
224
-
225
-
226
-
227
-
228
-
229
-
230
-
231
-
232
-
233
-
234
-
235
-
236
-
237
-
238
-
239
-
240
-
241
-
242
-
243
-
244
 |
 |

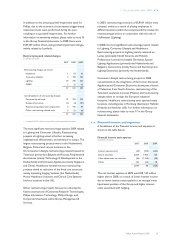
Sale of securities
in millions of euros
2007 2008 2009
Gain on sale of TSMC shares 2,783 1,205 −
Gain on sale of LG Display shares − 158 69
Gain on sale of D&M shares − 20 −
Gain on sale of Nuance shares 31 − −
Loss on sale of JDS Uniphase shares (10) − −
Gain on sale of Pace shares − − 48
Others − 23 9
2,804 1,406 126
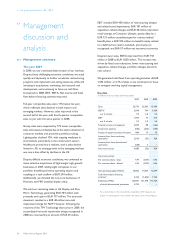
In 2009, income from the sale of securities totaled
EUR 126 million. This included a EUR 69 million gain from
the sale of remaining shares in LG Display, and a
EUR 48 million gain from the sale of remaining shares in
Pace Micro Technology. These gains were partially offset
by impairment charges amounting to EUR 58 million,
mainly from shareholdings in NXP. Other financial income
in 2009 primarily consisted of a EUR 19 million gain
related to the revaluation of the convertible bonds
received from TPV Technology and CBAY, and dividend
income totaling EUR 16 million, EUR 12 million of which
related to holdings in LG Display. Other financial
expenses included EUR 15 million accretion expenses
mainly associated with discounted asbestos provisions.
Value adjustments on securities
in millions of euros
2007 2008 2009
NXP − (599) (48)
LG Display − (448) −
TPO Display − (71) −
Pace Micro Technology − (30) −
Prime Technology − − (6)
JDS Uniphase (36) − −
Other − − (4)
(36) (1,148) (58)
2008 included a gain of EUR 1,406 million, mainly on the
sale of shares in TSMC, LG Display and D&M. 2008 also
included EUR 23 million dividend from TSMC. These were
partly offset by EUR 1,148 million non-cash impairment
losses at NXP, LG Display, and Pace Micro Technology.
Additionally, 2008 included a EUR 37 million loss related
to the revaluation of the TPV Technology convertible
bond.
For further information, refer to note 4 in the Group
financial statements.
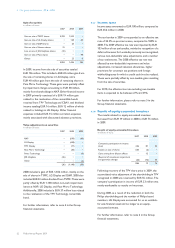
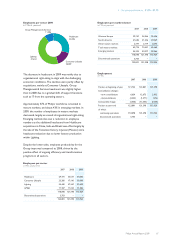
4.1.7 Income taxes
Income taxes amounted to EUR 100 million, compared to
EUR 256 million in 2008.
The tax burden in 2009 corresponded to an effective tax
rate of 22.3% on pre-tax income, compared to 180% in
2008. The 2009 effective tax rate was impacted by EUR
103 million of net tax benefits, mainly the recognition of a
deferred tax asset for Lumileds previously not recognized,
various non-deductible value adjustments, and a number
of tax settlements. The 2008 effective tax rate was
affected by non-deductible impairment and value
adjustments, increased valuation allowances, higher
provisions for uncertain tax positions and foreign
withholding taxes for which a credit could not be realized.
These were partially offset by non-taxable gains resulting
from the sale of securities.
For 2010, the effective tax rate excluding non-taxable
items is expected to be between 27% and 29%.
For further information, please refer to note 5 in the
Group financial statements.
4.1.8 Results of equity-accounted investees
The results related to equity-accounted investees
increased from EUR 19 million in 2008 to EUR 76 million
in 2009.
Results of equity-accounted investees
in millions of euros
2007 2008 2009
Company’s participation in income
(loss) 246 81 23
Results on sale of shares 660 (2) −
Gains arising from dilution effects − 12 −
(Reversal of) investment impairment
and guarantee charges (22) (72) 53
884 19 76
Following recovery of the TPV share price in 2009, the
accumulated value adjustment of the shareholding in TPV
recognized in 2008 was reversed by EUR 55 million. The
company’s participation in income of EUR 23 million was
mainly attributable to results on Intertrust.
During 2008, as a result of the reduction in both the
Philips shareholding and the number of Philips board
members, LG Display was accounted for as an available-
for-sale financial asset and no longer as an equity-
accounted investee.
For further information, refer to note 6 in the Group
financial statements.
4 Our group performance 4.1.6 - 4.1.9
62 Philips Annual Report 2009