Philips 2009 Annual Report Download - page 161
Download and view the complete annual report
Please find page 161 of the 2009 Philips annual report below. You can navigate through the pages in the report by either clicking on the pages listed below, or by using the keyword search tool below to find specific information within the annual report.-
 1
1 -
2
-
3
-
4
-
5
-
6
-
7
-
8
-
9
-
10
-
11
-
12
-
13
-
14
-
15
-
16
-
17
-
18
-
19
-
20
-
21
-
22
-
23
-
24
-
25
-
26
-
27
-
28
-
29
-
30
-
31
-
32
-
33
-
34
-
35
-
36
-
37
-
38
-
39
-
40
-
41
-
42
-
43
-
44
-
45
-
46
-
47
-
48
-
49
-
50
-
51
-
52
-
53
-
54
-
55
-
56
-
57
-
58
-
59
-
60
-
61
-
62
-
63
-
64
-
65
-
66
-
67
-
68
-
69
-
70
-
71
-
72
-
73
-
74
-
75
-
76
-
77
-
78
-
79
-
80
-
81
-
82
-
83
-
84
-
85
-
86
-
87
-
88
-
89
-
90
-
91
-
92
-
93
-
94
-
95
-
96
-
97
-
98
-
99
-
100
-
101
-
102
-
103
-
104
-
105
-
106
-
107
-
108
-
109
-
110
-
111
-
112
-
113
-
114
-
115
-
116
-
117
-
118
-
119
-
120
-
121
-
122
-
123
-
124
-
125
-
126
-
127
-
128
-
129
-
130
-
131
-
132
-
133
-
134
-
135
-
136
-
137
-
138
-
139
-
140
-
141
-
142
-
143
-
144
-
145
-
146
-
147
-
148
-
149
-
150
-
 151
151 -
 152
152 -
 153
153 -
 154
154 -
 155
155 -
 156
156 -
 157
157 -
 158
158 -
 159
159 -
 160
160 -
 161
161 -
 162
162 -
 163
163 -
 164
164 -
 165
165 -
 166
166 -
 167
167 -
 168
168 -
 169
169 -
 170
170 -
 171
171 -
172
-
173
-
174
-
175
-
176
-
177
-
178
-
179
-
180
-
181
-
182
-
183
-
184
-
185
-
186
-
187
-
188
-
189
-
190
-
191
-
192
-
193
-
194
-
195
-
196
-
197
-
198
-
199
-
200
-
201
-
202
-
203
-
204
-
205
-
206
-
207
-
208
-
209
-
210
-
211
-
212
-
213
-
214
-
215
-
216
-
217
-
218
-
219
-
220
-
221
-
222
-
223
-
224
-
225
-
226
-
227
-
228
-
229
-
230
-
231
-
232
-
233
-
234
-
235
-
236
-
237
-
238
-
239
-
240
-
241
-
242
-
243
-
244
 |
 |

2007 2008 2009
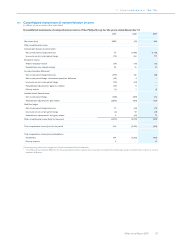
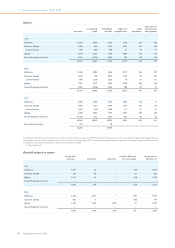
Cash flows from discontinued operations
Net cash used for operating activities (153) (49) −
Net cash provided by investing activities 38 12 −
Net cash used for discontinued operations (115) (37) −
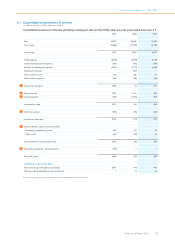
Net cash provided by (used for) continuing and discontinued operations 2,966 (5,218) 781
Effect of changes in exchange rates on cash and cash equivalents (112) (39) (15)
Cash and cash equivalents at the beginning of the year 6,023 8,877 3,620
Cash and cash equivalents at the end of the year 8,877 3,620 4,386
Less cash and cash equivalents at the end of the year - discontinued operations 108 − −
Cash and cash equivalents at the end of the year - continuing operations 8,769 3,620 4,386
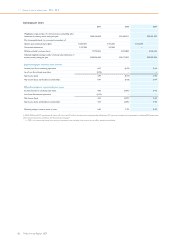
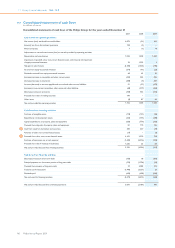
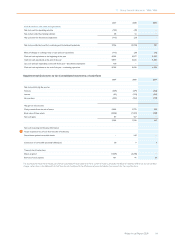
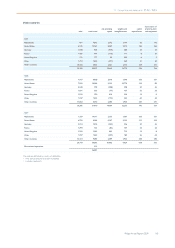
Supplemental disclosures to the Consolidated statements of cash flows
2007 2008 2009
Net cash paid during the year for
Pensions (449) (379) (422)
Interest (49) (123) (244)
Income taxes (493) (352) (197)
Net gain on sale of assets
Cash proceeds from the sale of assets 5,826 2,770 928
Book value of these assets (2,528) (1,341) (788)
Non-cash gains 87 107 −
3,385 1,536 140
Non-cash investing and financing information
Assets received in lieu of cash from the sale of businesses:
28
Shares/share options/convertible bonds − 148 −
Conversion of convertible personnel debentures 38 9 3
Treasury stock transactions
Shares acquired (1,609) (3,298) −
Exercise of stock options 161 41 29
The accompanying notes are an integral part of these consolidated financial statements. For a number of reasons, principally the effects of translation differences and consolidation
changes, certain items in the statements of cash flows do not correspond to the differences between the balance sheet amounts for the respective items.
11 Group financial statements 11.8 - 11.8
Philips Annual Report 2009 161