Philips 2009 Annual Report Download - page 160
Download and view the complete annual report
Please find page 160 of the 2009 Philips annual report below. You can navigate through the pages in the report by either clicking on the pages listed below, or by using the keyword search tool below to find specific information within the annual report.-
 1
1 -
2
-
3
-
4
-
5
-
6
-
7
-
8
-
9
-
10
-
11
-
12
-
13
-
14
-
15
-
16
-
17
-
18
-
19
-
20
-
21
-
22
-
23
-
24
-
25
-
26
-
27
-
28
-
29
-
30
-
31
-
32
-
33
-
34
-
35
-
36
-
37
-
38
-
39
-
40
-
41
-
42
-
43
-
44
-
45
-
46
-
47
-
48
-
49
-
50
-
51
-
52
-
53
-
54
-
55
-
56
-
57
-
58
-
59
-
60
-
61
-
62
-
63
-
64
-
65
-
66
-
67
-
68
-
69
-
70
-
71
-
72
-
73
-
74
-
75
-
76
-
77
-
78
-
79
-
80
-
81
-
82
-
83
-
84
-
85
-
86
-
87
-
88
-
89
-
90
-
91
-
92
-
93
-
94
-
95
-
96
-
97
-
98
-
99
-
100
-
101
-
102
-
103
-
104
-
105
-
106
-
107
-
108
-
109
-
110
-
111
-
112
-
113
-
114
-
115
-
116
-
117
-
118
-
119
-
120
-
121
-
122
-
123
-
124
-
125
-
126
-
127
-
128
-
129
-
130
-
131
-
132
-
133
-
134
-
135
-
136
-
137
-
138
-
139
-
140
-
141
-
142
-
143
-
144
-
145
-
146
-
147
-
148
-
149
-
 150
150 -
 151
151 -
 152
152 -
 153
153 -
 154
154 -
 155
155 -
 156
156 -
 157
157 -
 158
158 -
 159
159 -
 160
160 -
 161
161 -
 162
162 -
 163
163 -
 164
164 -
 165
165 -
 166
166 -
 167
167 -
 168
168 -
 169
169 -
 170
170 -
171
-
172
-
173
-
174
-
175
-
176
-
177
-
178
-
179
-
180
-
181
-
182
-
183
-
184
-
185
-
186
-
187
-
188
-
189
-
190
-
191
-
192
-
193
-
194
-
195
-
196
-
197
-
198
-
199
-
200
-
201
-
202
-
203
-
204
-
205
-
206
-
207
-
208
-
209
-
210
-
211
-
212
-
213
-
214
-
215
-
216
-
217
-
218
-
219
-
220
-
221
-
222
-
223
-
224
-
225
-
226
-
227
-
228
-
229
-
230
-
231
-
232
-
233
-
234
-
235
-
236
-
237
-
238
-
239
-
240
-
241
-
242
-
243
-
244
 |
 |
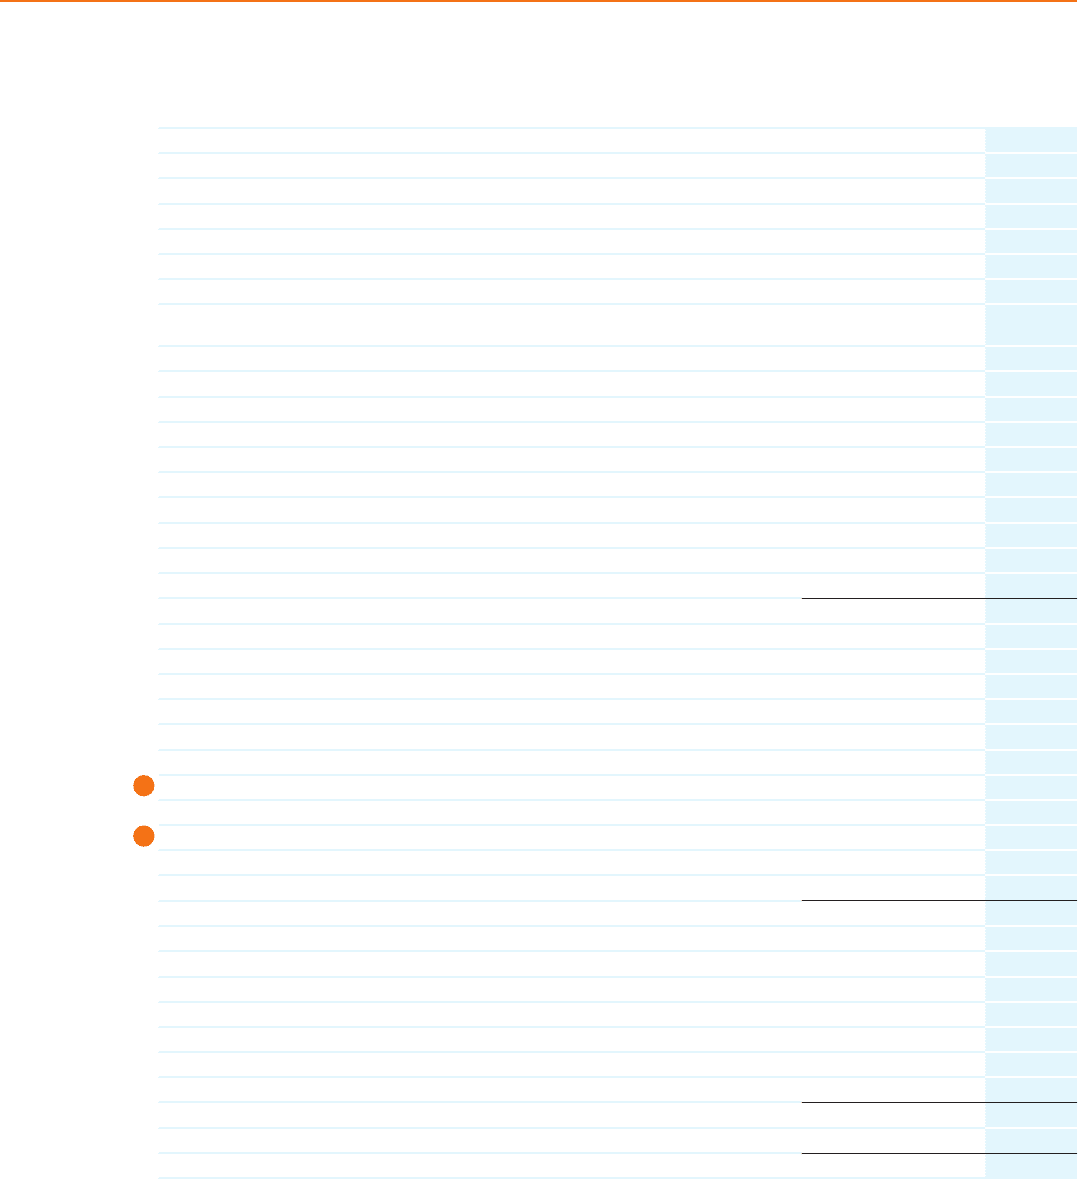
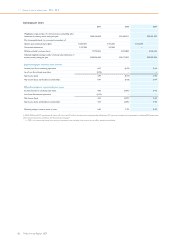
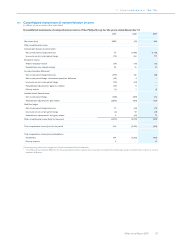
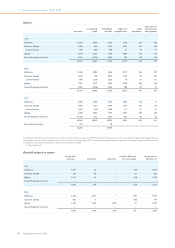
11.8 Consolidated statements of cash flows
in millions of euros
Consolidated statements of cash flows of the Philips Group for the years ended December 31
2007 2008 2009
Cash flows from operating activities
Net income (loss) attributable to stockholders 4,873 (91) 410
(Income) loss from discontinued operations 138 (3) −
Minority interests 7 (1) 14
Adjustments to reconcile net income (loss) to net cash provided by operating activities:
Depreciation and amortization 1,083 1,528 1,469
Impairment of goodwill, other non-current financial assets, and (reversal of) impairment
of equity-accounted investees 39 1,509 2
Net gain on sale of assets (3,385) (1,536) (140)
Income from equity-accounted investees (371) (91) (23)
Dividends received from equity-accounted investees 48 65 35
(Increase) decrease in receivables and other current assets (435) 234 496
(Increase) decrease in inventories (348) (9) 687
Increase (decrease) in accounts payable and accrued and other current liabilities 91 (97) (479)
(Increase) in non-current receivables, other assets and other liabilities (68) (379) (363)
(Decrease) increase in provisions (108) 432 (612)
Proceeds from sales of trading securities 196 − −
Other items (8) 87 49
Net cash provided by operating activities 1,752 1,648 1,545
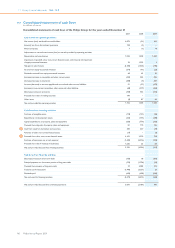
Cash flows from investing activities
Purchase of intangible assets (118) (121) (96)
Expenditures on development assets (233) (154) (188)
Capital expenditures on property, plant and equipment (658) (770) (524)
Proceeds from disposals of property, plant and equipment 81 170 126
Cash from (used for) derivatives and securities
26 385 337 (39)
Purchase of other non-current financial assets (17) − (6)
Proceeds from other non-current financial assets
27 4,105 2,576 718
Purchase of businesses, net of cash acquired (1,485) (5,316) (294)
Proceeds from sale of interests in businesses 1,640 24 84
Net cash provided by (used for) investing activities 3,700 (3,254) (219)
Cash flows from financing activities
(Decrease) increase in short-term debt (158) 18 (201)
Principal payments on short-term portion of long-term debt (155) (1,726) (51)
Proceeds from issuance of long-term debt 29 2,088 312
Treasury stock transactions (1,448) (3,257) 29
Dividends paid (639) (698) (634)
Net cash used for financing activities (2,371) (3,575) (545)
Net cash provided by (used for) continuing operations 3,081 (5,181) 781
11 Group financial statements 11.8 - 11.8
160 Philips Annual Report 2009