Philips 2009 Annual Report Download - page 58
Download and view the complete annual report
Please find page 58 of the 2009 Philips annual report below. You can navigate through the pages in the report by either clicking on the pages listed below, or by using the keyword search tool below to find specific information within the annual report.-
 1
1 -
2
-
3
-
4
-
5
-
6
-
7
-
8
-
9
-
10
-
11
-
12
-
13
-
14
-
15
-
16
-
17
-
18
-
19
-
20
-
21
-
22
-
23
-
24
-
25
-
26
-
27
-
28
-
29
-
30
-
31
-
32
-
33
-
34
-
35
-
36
-
37
-
38
-
39
-
40
-
41
-
42
-
43
-
44
-
45
-
46
-
47
-
 48
48 -
 49
49 -
 50
50 -
 51
51 -
 52
52 -
 53
53 -
 54
54 -
 55
55 -
 56
56 -
 57
57 -
 58
58 -
 59
59 -
 60
60 -
 61
61 -
 62
62 -
 63
63 -
 64
64 -
 65
65 -
 66
66 -
 67
67 -
 68
68 -
69
-
70
-
71
-
72
-
73
-
74
-
75
-
76
-
77
-
78
-
79
-
80
-
81
-
82
-
83
-
84
-
85
-
86
-
87
-
88
-
89
-
90
-
91
-
92
-
93
-
94
-
95
-
96
-
97
-
98
-
99
-
100
-
101
-
102
-
103
-
104
-
105
-
106
-
107
-
108
-
109
-
110
-
111
-
112
-
113
-
114
-
115
-
116
-
117
-
118
-
119
-
120
-
121
-
122
-
123
-
124
-
125
-
126
-
127
-
128
-
129
-
130
-
131
-
132
-
133
-
134
-
135
-
136
-
137
-
138
-
139
-
140
-
141
-
142
-
143
-
144
-
145
-
146
-
147
-
148
-
149
-
150
-
151
-
152
-
153
-
154
-
155
-
156
-
157
-
158
-
159
-
160
-
161
-
162
-
163
-
164
-
165
-
166
-
167
-
168
-
169
-
170
-
171
-
172
-
173
-
174
-
175
-
176
-
177
-
178
-
179
-
180
-
181
-
182
-
183
-
184
-
185
-
186
-
187
-
188
-
189
-
190
-
191
-
192
-
193
-
194
-
195
-
196
-
197
-
198
-
199
-
200
-
201
-
202
-
203
-
204
-
205
-
206
-
207
-
208
-
209
-
210
-
211
-
212
-
213
-
214
-
215
-
216
-
217
-
218
-
219
-
220
-
221
-
222
-
223
-
224
-
225
-
226
-
227
-
228
-
229
-
230
-
231
-
232
-
233
-
234
-
235
-
236
-
237
-
238
-
239
-
240
-
241
-
242
-
243
-
244
 |
 |

4.1 Management
discussion and
analysis
4.1.1 Management summary
The year 2009
In 2009, we saw continued deterioration of our markets.
Despite these challenging economic conditions, we acted
quickly and decisively to further accelerate restructuring
programs and implement cost-saving measures, while still
investing in acquisitions, marketing, and research and
development, and continuing to focus on cash flow.
Compared to 2008, EBIT, EBITA, Net income and Cash
flow before financing activities improved.
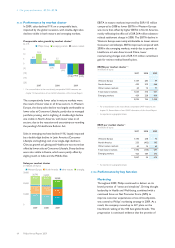
Full-year comparable sales were 11% below last year,
which reflected sales declines in both mature and
emerging markets. However, sales improved in the
second half of the year with fourth-quarter comparable
sales on par with the same quarter in 2008.
Group sales were impacted by 17% lower comparable
sales at Consumer Lifestyle due to the severe downturn in
consumer markets and proactive portfolio pruning;
Lighting sales declined 13%, with ongoing weakness in
end-markets, particularly in the construction sector;
Healthcare proved more resilient, with a sales decline
limited to 3%, as strong growth in the emerging markets
was more than offset by declines in the US.
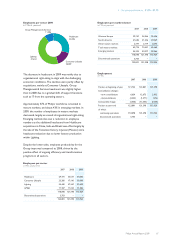
Despite difficult economic conditions, we continued to
make selective acquisitions of high-margin, high-growth
businesses in 2009, adding eight companies to our
portfolio, benefiting all three operating sectors and
resulting in a cash outflow of EUR 294 million.
Additionally, we divested the non-core businesses of
Monitors and FIMI (medical display units).
We sold our remaining stake in LG Display and Pace
Micro Technology, generating EUR 704 million cash
proceeds and a gain of EUR 117 million. The economic
downturn resulted in a EUR 48 million non-cash
impairment charge for NXP. However, following the
recovery of the TPV Technology share price in 2009, the
accumulated non-cash impairment charge recognized in
2008 was reversed by an amount of EUR 55 million.
EBIT included EUR 450 million of restructuring charges
and related asset impairments, EUR 101 million of
acquisition-related charges, and EUR 48 million of product
recall charges at Consumer Lifestyle, partly offset by a
EUR 131 million curtailment gain for retiree medical
benefit plans, a EUR 103 million tax benefit mainly related
to a deferred tax asset in Lumileds, previously not
recognized, and EUR 57 million net insurance recoveries.
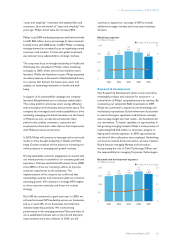
Despite lower sales, EBITA improved from EUR 744
million in 2008 to EUR 1,050 million. The increase was
driven by fixed cost reductions, lower restructuring and
acquisition-related charges, portfolio changes and strict
cost control.
We generated cash flows from operating activities of EUR
1,545 million, or 6.7% of sales, as we continued our focus
on stringent working capital management.
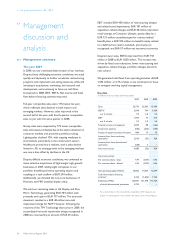
Key data
in millions of euros unless otherwise stated
2007 2008 2009
Sales 26,793 26,385 23,189
EBITA1) 2,094 744 1,050
as a % of sales 7.8 2.8 4.5
EBIT 1,867 54 614
as a % of sales 7.0 0.2 2.6
Financial income and expenses 2,849 88 (166)
Income tax expense (582) (256) (100)
Results of equity-accounted investees 884 19 76
Income (loss) from continuing
operations 5,018 (95) 424
Income (loss) from discontinued
operations (138) 3 −
Net income (loss) 4,880 (92) 424
Net income (loss):
Per common share - basic 4.49 (0.09) 0.46
Per common share - diluted 4.43 (0.09) 0.46
Net operating capital (NOC)1) 10,802 14,069 12,649
Cash flows before financing
activities1) 5,452 (1,606) 1,326
Employees (FTEs) 123,801 121,398 115,924
of which discontinued operations 5,703 − −
1) For a reconciliation to the most directly comparable GAAP measures, see
chapter 14, Reconciliation of non-GAAP information, of this Annual Report.
4 Our group performance 4.1 - 4.1.1
58 Philips Annual Report 2009