Philips 2009 Annual Report Download - page 74
Download and view the complete annual report
Please find page 74 of the 2009 Philips annual report below. You can navigate through the pages in the report by either clicking on the pages listed below, or by using the keyword search tool below to find specific information within the annual report.-
 1
1 -
2
-
3
-
4
-
5
-
6
-
7
-
8
-
9
-
10
-
11
-
12
-
13
-
14
-
15
-
16
-
17
-
18
-
19
-
20
-
21
-
22
-
23
-
24
-
25
-
26
-
27
-
28
-
29
-
30
-
31
-
32
-
33
-
34
-
35
-
36
-
37
-
38
-
39
-
40
-
41
-
42
-
43
-
44
-
45
-
46
-
47
-
48
-
49
-
50
-
51
-
52
-
53
-
54
-
55
-
56
-
57
-
58
-
59
-
60
-
61
-
62
-
63
-
 64
64 -
 65
65 -
 66
66 -
 67
67 -
 68
68 -
 69
69 -
 70
70 -
 71
71 -
 72
72 -
 73
73 -
 74
74 -
 75
75 -
 76
76 -
 77
77 -
 78
78 -
 79
79 -
 80
80 -
 81
81 -
 82
82 -
 83
83 -
 84
84 -
85
-
86
-
87
-
88
-
89
-
90
-
91
-
92
-
93
-
94
-
95
-
96
-
97
-
98
-
99
-
100
-
101
-
102
-
103
-
104
-
105
-
106
-
107
-
108
-
109
-
110
-
111
-
112
-
113
-
114
-
115
-
116
-
117
-
118
-
119
-
120
-
121
-
122
-
123
-
124
-
125
-
126
-
127
-
128
-
129
-
130
-
131
-
132
-
133
-
134
-
135
-
136
-
137
-
138
-
139
-
140
-
141
-
142
-
143
-
144
-
145
-
146
-
147
-
148
-
149
-
150
-
151
-
152
-
153
-
154
-
155
-
156
-
157
-
158
-
159
-
160
-
161
-
162
-
163
-
164
-
165
-
166
-
167
-
168
-
169
-
170
-
171
-
172
-
173
-
174
-
175
-
176
-
177
-
178
-
179
-
180
-
181
-
182
-
183
-
184
-
185
-
186
-
187
-
188
-
189
-
190
-
191
-
192
-
193
-
194
-
195
-
196
-
197
-
198
-
199
-
200
-
201
-
202
-
203
-
204
-
205
-
206
-
207
-
208
-
209
-
210
-
211
-
212
-
213
-
214
-
215
-
216
-
217
-
218
-
219
-
220
-
221
-
222
-
223
-
224
-
225
-
226
-
227
-
228
-
229
-
230
-
231
-
232
-
233
-
234
-
235
-
236
-
237
-
238
-
239
-
240
-
241
-
242
-
243
-
244
 |
 |
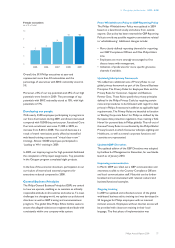
4.3 Sustainability
4.3.1 Management summary
Results in 2009
In 2009 we made good progress against our Sustainability
targets, focusing on:
• driving the implementation of our EcoVision programs,
• strengthening the energy-efficient and Green Product
approach at both Healthcare and Consumer Lifestyle,
leveraging the experience of our Lighting sector,
• making our supply chain fully compliant with the
Electronic Industry Code of Conduct standard, and
• including suppliers of our recent acquisitions into the
Supplier Sustainability Involvement Program.
Results are detailed on the following pages and in the
Sustainability performance section.
4.3.2 EcoVision III
Our EcoVision III environmental action program began in
2006 and ended in 2009. EcoVision III mainly called for
improvements in all major environmental parameters in
manufacturing, compared to the base year 2005.
EcoVision III covers the contributors to climate change
(energy, PFCs and other greenhouse gases), water, waste
and a selection of the most relevant restricted and
hazardous substances. We exceeded our Global
Warming Potential reductions, as well as the water and
waste targets. For restricted substances, we reduced the
total amount by 88% compared with 2005, but did not
meet the targets for some substances. For hazardous
substances, the total amount decreased significantly. (Full
details can be found in the Sustainability performance
section.)
In order to continue our efforts to improve our
environmental performance in manufacturing, we will
evaluate new targets as part of our new Chemicals
Management program introduction later in 2010.
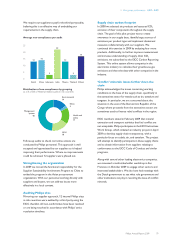
4.3.3 EcoVision4
With our latest environmental action program,
EcoVision4, we have committed to realize the following by
2012:
• generate 30% of total revenues from Green Products
• double investment in Green Innovations to a cumulative
EUR 1 billion
• improve our operational energy efficiency by 25% and
reduce CO2 emissions by 25%, all compared with the
base year of 2007.
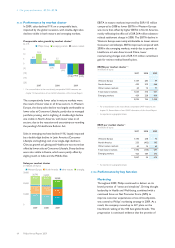
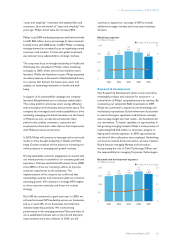
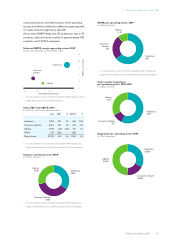
We are well on track to reach the above targets. In 2009,
31% of total sales were from Green Products, meeting the
first target three years ahead of plan. Over EUR 400
million was invested in Green Innovations in 2009, and we
expect to meet the second target in 2010. Our
operational carbon footprint decreased 10% compared to
2008, putting us on track to reach the third target as well.
Results for each target are highlighted from section Green
Product sales onwards.
4.3.4 EcoVision5
Leveraging sustainability as an integral part of
our strategy and additional growth driver
Sustainability at Philips is all about improving the health
and well-being of individuals and the communities they live
in. At the same time we strive relentlessly to improve the
environmental performance of our products and
processes, and to drive sustainability throughout the
supply chain.
In 2009 we evaluated our sustainability strategy and
resolved to fully leverage sustainability as an integral part
of our overall strategy and an additional driver of growth,
as reflected in the Philips Management Agenda.
To deliver on our brand promise of “sense and simplicity”
and at the same time provide the company direction for
the longer term in this area, we announced on February
22, 2010 three sustainability leadership key performance
indicators where we can bring our competencies to bear
‘care’, ‘energy efficiency’ and ‘materials’ including targets
for 2015:
• Bringing care to people
Target: 500 million lives touched by 2015
• Improving energy efficiency of Philips products
Target: 50% improvement by 2015 (for the average
total product portfolio) compared to 2009
• Closing the materials loop
Target: Double global collection and recycling amounts
and recycled materials in products in 2015 compared to
2009
4 Our group performance 4.3 - 4.3.4
74 Philips Annual Report 2009