Philips 2009 Annual Report Download - page 123
Download and view the complete annual report
Please find page 123 of the 2009 Philips annual report below. You can navigate through the pages in the report by either clicking on the pages listed below, or by using the keyword search tool below to find specific information within the annual report.-
 1
1 -
2
-
3
-
4
-
5
-
6
-
7
-
8
-
9
-
10
-
11
-
12
-
13
-
14
-
15
-
16
-
17
-
18
-
19
-
20
-
21
-
22
-
23
-
24
-
25
-
26
-
27
-
28
-
29
-
30
-
31
-
32
-
33
-
34
-
35
-
36
-
37
-
38
-
39
-
40
-
41
-
42
-
43
-
44
-
45
-
46
-
47
-
48
-
49
-
50
-
51
-
52
-
53
-
54
-
55
-
56
-
57
-
58
-
59
-
60
-
61
-
62
-
63
-
64
-
65
-
66
-
67
-
68
-
69
-
70
-
71
-
72
-
73
-
74
-
75
-
76
-
77
-
78
-
79
-
80
-
81
-
82
-
83
-
84
-
85
-
86
-
87
-
88
-
89
-
90
-
91
-
92
-
93
-
94
-
95
-
96
-
97
-
98
-
99
-
100
-
101
-
102
-
103
-
104
-
105
-
106
-
107
-
108
-
109
-
110
-
111
-
112
-
 113
113 -
 114
114 -
 115
115 -
 116
116 -
 117
117 -
 118
118 -
 119
119 -
 120
120 -
 121
121 -
 122
122 -
 123
123 -
 124
124 -
 125
125 -
 126
126 -
 127
127 -
 128
128 -
 129
129 -
 130
130 -
 131
131 -
 132
132 -
 133
133 -
134
-
135
-
136
-
137
-
138
-
139
-
140
-
141
-
142
-
143
-
144
-
145
-
146
-
147
-
148
-
149
-
150
-
151
-
152
-
153
-
154
-
155
-
156
-
157
-
158
-
159
-
160
-
161
-
162
-
163
-
164
-
165
-
166
-
167
-
168
-
169
-
170
-
171
-
172
-
173
-
174
-
175
-
176
-
177
-
178
-
179
-
180
-
181
-
182
-
183
-
184
-
185
-
186
-
187
-
188
-
189
-
190
-
191
-
192
-
193
-
194
-
195
-
196
-
197
-
198
-
199
-
200
-
201
-
202
-
203
-
204
-
205
-
206
-
207
-
208
-
209
-
210
-
211
-
212
-
213
-
214
-
215
-
216
-
217
-
218
-
219
-
220
-
221
-
222
-
223
-
224
-
225
-
226
-
227
-
228
-
229
-
230
-
231
-
232
-
233
-
234
-
235
-
236
-
237
-
238
-
239
-
240
-
241
-
242
-
243
-
244
 |
 |

7.3 Share information
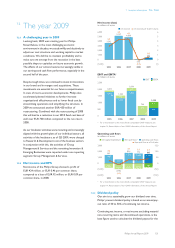
7.3.1 Market capitalization
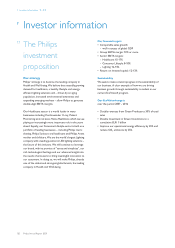
Philips’ market capitalization was EUR 19.2 billion at year-
end 2009. The highest closing price for Philips’ shares in
2009 was EUR 21.03 on December 29, 2009 and the
lowest was EUR 10.95 on March 30, 2009, both in
Amsterdam.
Market capitalization
in billions of euros
■
■-market capitalization of Philips--■-of which publicly quoted stakes
40
30
20
10
0
2005 2006 2007 2008 2009
7.3.2 Share capital structure
During 2009, Philips’ issued share capital remained at a
level of 972 million common shares. The basic shares
outstanding increased slightly from 923 million at the end
of December 2008 to 927 million shares at the end of
2009. As of December 31, 2009, the shares held in
treasury amounted to 45.0 million shares, of which 43.1
million are held by Philips to cover long-term incentive
and employee stock purchase plans.
The Dutch Financial Markets Supervision Act (Wet op het
financieel toezicht) imposes a duty to disclose percentage
holdings in the capital and/or voting rights in the Company
when such holding reaches, exceeds or falls below 5%,
10%, 15%, 20%, 25%, 30%, 40%, 50%, 60%, 75% and 95%.
Such disclosure must be made to the Netherlands
Authority for the Financial Markets (AFM) without delay.
The AFM then notifies the Company.
On April 20, 2009, the Company received notification
from the AFM that it had received disclosures under the
Financial Markets Supervision Act of a substantial holding
of 5.02% by Southeastern Asset Management, Inc. in the
Company’s common shares, which was subsequently
reduced to below 5% as of December 14, 2009. On
December 1, 2009, the Company received notification
from the AFM that it had received disclosures under the
Financial Markets Supervision Act of a substantial holding
of 5.03% by BlackRock Inc. in the Company’s common
shares.
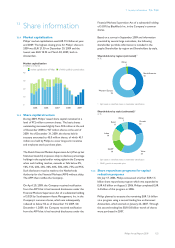
Based on a survey in September 2009 and information
provided by several large custodians, the following
shareholder portfolio information is included in the
graphs Shareholder by region and Shareholders by style.
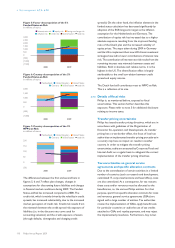
Shareholders by region (estimated)1)
in %
North America
42
Western Europe
56
Other
2
1) Split based on identified shares in shareholder identification
Shareholders by style (estimated)1)
in %
Growth
20
Value
37
GARP
14
2)
Index
14
Retail
8
Other
7
1) Split based on identified shares in shareholder identification
2) GARP: growth at reasonable price
7.3.3 Share repurchase programs for capital
reduction purposes
On July 17, 2006, Philips announced a further EUR 1.5
billion share repurchase program which was expanded to
EUR 4.0 billion on August 3, 2006. Philips completed EUR
2.4 billion of this program in 2006.
Philips planned to execute the remaining EUR 1.6 billion
via a program using a second trading line on Euronext
Amsterdam, which started on January 22, 2007. Through
this second trading line EUR 0.8 billion worth of shares
were purchased in 2007.
7 Investor information 7.3 - 7.3.3
Philips Annual Report 2009 123