Philips 2009 Annual Report Download - page 221
Download and view the complete annual report
Please find page 221 of the 2009 Philips annual report below. You can navigate through the pages in the report by either clicking on the pages listed below, or by using the keyword search tool below to find specific information within the annual report.-
 1
1 -
2
-
3
-
4
-
5
-
6
-
7
-
8
-
9
-
10
-
11
-
12
-
13
-
14
-
15
-
16
-
17
-
18
-
19
-
20
-
21
-
22
-
23
-
24
-
25
-
26
-
27
-
28
-
29
-
30
-
31
-
32
-
33
-
34
-
35
-
36
-
37
-
38
-
39
-
40
-
41
-
42
-
43
-
44
-
45
-
46
-
47
-
48
-
49
-
50
-
51
-
52
-
53
-
54
-
55
-
56
-
57
-
58
-
59
-
60
-
61
-
62
-
63
-
64
-
65
-
66
-
67
-
68
-
69
-
70
-
71
-
72
-
73
-
74
-
75
-
76
-
77
-
78
-
79
-
80
-
81
-
82
-
83
-
84
-
85
-
86
-
87
-
88
-
89
-
90
-
91
-
92
-
93
-
94
-
95
-
96
-
97
-
98
-
99
-
100
-
101
-
102
-
103
-
104
-
105
-
106
-
107
-
108
-
109
-
110
-
111
-
112
-
113
-
114
-
115
-
116
-
117
-
118
-
119
-
120
-
121
-
122
-
123
-
124
-
125
-
126
-
127
-
128
-
129
-
130
-
131
-
132
-
133
-
134
-
135
-
136
-
137
-
138
-
139
-
140
-
141
-
142
-
143
-
144
-
145
-
146
-
147
-
148
-
149
-
150
-
151
-
152
-
153
-
154
-
155
-
156
-
157
-
158
-
159
-
160
-
161
-
162
-
163
-
164
-
165
-
166
-
167
-
168
-
169
-
170
-
171
-
172
-
173
-
174
-
175
-
176
-
177
-
178
-
179
-
180
-
181
-
182
-
183
-
184
-
185
-
186
-
187
-
188
-
189
-
190
-
191
-
192
-
193
-
194
-
195
-
196
-
197
-
198
-
199
-
200
-
201
-
202
-
203
-
204
-
205
-
206
-
207
-
208
-
209
-
210
-
 211
211 -
 212
212 -
 213
213 -
 214
214 -
 215
215 -
 216
216 -
 217
217 -
 218
218 -
 219
219 -
 220
220 -
 221
221 -
 222
222 -
 223
223 -
 224
224 -
 225
225 -
 226
226 -
 227
227 -
 228
228 -
 229
229 -
 230
230 -
 231
231 -
232
-
233
-
234
-
235
-
236
-
237
-
238
-
239
-
240
-
241
-
242
-
243
-
244
 |
 |

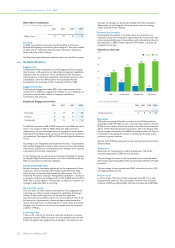
Total carbon emissions in manufacturing per sector
in kilotons CO2-equivalent
2006 2007 2008 2009
Healthcare 114 113 117 119
Consumer Lifestyle 64 66 65 50
Lighting 685 675 642 643
Group Management & Services 6 2 1 2
Philips Group 869 856 825 814
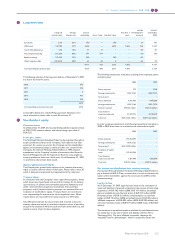
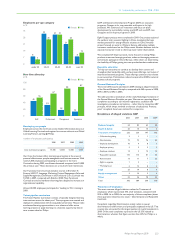
EcoVision III: Water usage in manufacturing
Water is used primarily for domestic purposes, with the exception of
Lighting where it is also used in manufacturing, representing about 84%
of total water usage. Total water intake in 2009 was 4.2 million m3, 6%
higher than in 2008. This increase was primarily in Lighting as a result of
acquisitions.
Water intake
in thousands m3
2006 2007 2008 2009
Healthcare 406 369 370 363
Consumer Lifestyle 509 485 452 317
Lighting 3,217 3,350 3,134 3,531
Group Management & Services 39 5 6 8
Philips Group 4,171 4,209 3,962 4,219
In 2009, 74% of water was purchased and 26% was extracted from
groundwater wells.
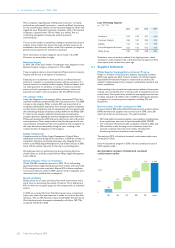
EcoVision III: Waste in manufacturing
Total waste decreased 14%, to 98 kilotons in 2009 from 114 kilotons in
2008. Lighting (71%) and Consumer Lifestyle (21%) account for 92% of
our worldwide total waste. The decrease was mainly realized by
Lighting as a result of lower volumes and increased internal recycling,
and by lower production in Consumer Lifestyle.
Total waste
in kilotons
2006 2007 2008 2009
Healthcare 8.3 7.9 8.2 8.2
Consumer Lifestyle 35.0 40.4 28.0 20.0
Lighting 80.6 79.2 77.3 69.3
Group Management & Services 1.5 0.1 0.1 0.1
Philips Group 125.4 127.6 113.6 97.6
Total waste is made up of actual waste that is delivered for either landfill
or incineration, consisting of 18% non-hazardous and 5% hazardous
waste, and recyclable waste. Materials delivered for recycling via an
external contractor comprised 75 kilotons, which equals 77% of total
waste.
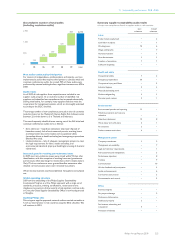
EcoVision III: Restricted substances
Emissions of restricted substances totaled 638 kilos in 2009, a steep
decrease of 42% versus 2008. With EcoVision III we are focusing on a
selection of the most important substances in our processes.
Restricted substances
in kilos
2006 2007 2008 2009
Benzene 6 52 1 136
Mercury 197 185 211 122
CFCs/HCFCs1) 160 157 213 14
Other restricted substances 1,734 973 673 366
Total 2,097 1,367 1,098 638
1) excluding cooling systems
Benzene
Lighting is the only sector that uses benzene in manufacturing. The
increase in 2009 was caused by acquisitions.
Mercury
Mercury is used exclusively by Lighting. Emissions decreased
significantly from 211 kg in 2008 to 122 kg in 2009, due to a production
relocation, reduced volumes along with a product mix change.
CFCs/HCFCs
In 2009 total emissions from CFCs/HCFCs fell to 14 kg from 213 kg due
to the phase-out of certain restricted substances and a change in the
production mix at a Healthcare site.
Other restricted substances
Emissions of other restricted substances totaled 366 kg in 2009,
strongly decreasing from 673 kg the previous year. This decrease
relates particularly to the phasing out of certain substances at
Healthcare, partially off-set by Lighting acquisitions.
EcoVision III: Hazardous substances
For hazardous substances targets have been set on a selected number of
substances and not for the total, as listed in the table.
Hazardous substances
in kilos
2006 2007 2008 2009
Lead and lead compounds 4,257 3,958 8,074 5,815
PFCs (Per Fluorinated
Compounds) 1,461 1,534 1,858 2,535
Toluene 3,091 1,029 1,120 1,110
Xylene 4,493 4,166 3,326 4,064
Other hazardous substances 106,153 131,738 125,251 86,528
Total 119,455 142,425 139,629 100,052
Lead and lead compounds
The decrease in 2009 is related mainly to the introduction of a lead-free
solder process in one of the Lighting factories outside Europe.
PFCs
The increase in 2009 is related to Lighting acquisitions, partially off-set
by lower production volumes at one Healthcare site.
Toluene
The use of toluene, mainly used in wet lacquers, remained stable in
2009.
Xylene
The increase is attributable to a changed product mix in Lighting.
Other hazardous substances
The use of styrene decreased significantly due to lower volumes in
Lighting.
ISO 14001 certification
In 2009, 92% of reporting manufacturing sites was certified. This 3%
decrease from the previous year can be attributed to new acquisitions.
13 Sustainability performance 13.3 - 13.3
Philips Annual Report 2009 221