Philips 2009 Annual Report Download - page 178
Download and view the complete annual report
Please find page 178 of the 2009 Philips annual report below. You can navigate through the pages in the report by either clicking on the pages listed below, or by using the keyword search tool below to find specific information within the annual report.-
 1
1 -
2
-
3
-
4
-
5
-
6
-
7
-
8
-
9
-
10
-
11
-
12
-
13
-
14
-
15
-
16
-
17
-
18
-
19
-
20
-
21
-
22
-
23
-
24
-
25
-
26
-
27
-
28
-
29
-
30
-
31
-
32
-
33
-
34
-
35
-
36
-
37
-
38
-
39
-
40
-
41
-
42
-
43
-
44
-
45
-
46
-
47
-
48
-
49
-
50
-
51
-
52
-
53
-
54
-
55
-
56
-
57
-
58
-
59
-
60
-
61
-
62
-
63
-
64
-
65
-
66
-
67
-
68
-
69
-
70
-
71
-
72
-
73
-
74
-
75
-
76
-
77
-
78
-
79
-
80
-
81
-
82
-
83
-
84
-
85
-
86
-
87
-
88
-
89
-
90
-
91
-
92
-
93
-
94
-
95
-
96
-
97
-
98
-
99
-
100
-
101
-
102
-
103
-
104
-
105
-
106
-
107
-
108
-
109
-
110
-
111
-
112
-
113
-
114
-
115
-
116
-
117
-
118
-
119
-
120
-
121
-
122
-
123
-
124
-
125
-
126
-
127
-
128
-
129
-
130
-
131
-
132
-
133
-
134
-
135
-
136
-
137
-
138
-
139
-
140
-
141
-
142
-
143
-
144
-
145
-
146
-
147
-
148
-
149
-
150
-
151
-
152
-
153
-
154
-
155
-
156
-
157
-
158
-
159
-
160
-
161
-
162
-
163
-
164
-
165
-
166
-
167
-
 168
168 -
 169
169 -
 170
170 -
 171
171 -
 172
172 -
 173
173 -
 174
174 -
 175
175 -
 176
176 -
 177
177 -
 178
178 -
 179
179 -
 180
180 -
 181
181 -
 182
182 -
 183
183 -
 184
184 -
 185
185 -
 186
186 -
 187
187 -
 188
188 -
189
-
190
-
191
-
192
-
193
-
194
-
195
-
196
-
197
-
198
-
199
-
200
-
201
-
202
-
203
-
204
-
205
-
206
-
207
-
208
-
209
-
210
-
211
-
212
-
213
-
214
-
215
-
216
-
217
-
218
-
219
-
220
-
221
-
222
-
223
-
224
-
225
-
226
-
227
-
228
-
229
-
230
-
231
-
232
-
233
-
234
-
235
-
236
-
237
-
238
-
239
-
240
-
241
-
242
-
243
-
244
 |
 |

gain). Besides in 2009, General and administrative expenses also include
a curtailment gain for retiree medical benefit plan amounting EUR 131
million.
Research and development expenses
Expenses for research and development activities amounted to
EUR 1,631 million, representing 7.0% of Group sales (2008: EUR 1,777
million, 6.7% of Group sales 2007: EUR 1,601 million, 6.0% of Group
sales).
For information related to Research and development expenses on a
sector basis, see section 11.10, Information by sector and main country,
of this Annual Report.
Impairment of goodwill
In 2009, no goodwill impairment charges were recorded (2008:
EUR 301 million, 2007: EUR nil).
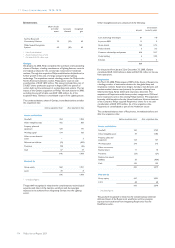
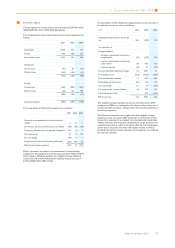
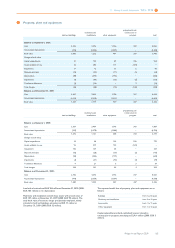
Other business income (expenses)
Other business income (expenses) consists of the following:
2007 2008 2009
Result on disposal of businesses:
- income 35 136 13
- expense (65) (45) (13)
Result on disposal of fixed assets:
- income 107 72 33
- expense (24) (16) (13)
Result on remaining businesses:
- income 127 53 51
- expense (76) (25) (12)
104 175 59
Results on the disposal of businesses consisted of:
2007 2008 2009
Automotive Playback Modules (30) − −
Set-Top Boxes and Connectivity Solutions − 42 −
Philips Speech Recognition Systems − 45 −
Other − 4 −
(30) 91 −
The results on the disposal of businesses in 2008 are mainly related to
the sale of the Set-Top Boxes and Connectivity Solutions activities to
Pace Micro Technology which resulted in a gain of EUR 42 million, and
the sale of Philips Speech Recognition activities to Nuance
Communications which resulted in a gain of EUR 45 million. The result
on the disposal of fixed assets is mainly related to the sale of fixed assets
in Taiwan with a gain of EUR 39 million.
The result on the disposal of businesses in 2007 mainly related to the
sale of Automotive Playback Modules which resulted in a loss of EUR 30
million. The result on the sale of fixed assets mainly related to the sale of
certain buildings in Austria and the Netherlands as well as land in the US.
The other business results are mainly attributable to certain
settlements and the finalization of several divestitures.
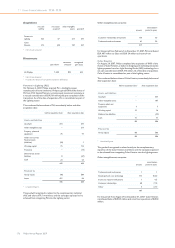
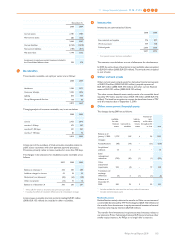
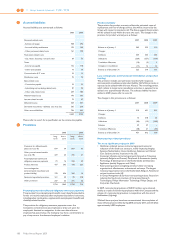
4Financial income and expenses
2007 2008 2009
Interest income 236 141 45
Interest expense (279) (246) (297)
Net interest expense (43) (105) (252)
Sale of securities 2,804 1,406 126
Impairment of securities (36) (1,148) (58)
Foreign exchange results (1) (13) (7)
Other financial income 153 47 54
Other financial expenses (28) (99) (29)
2,892 193 86
2,849 88 (166)
Financial income consists of interest income, the gain on the sale of
securities and other financial income. Financial expenses consist of
interest expense, impairment charges on securities, foreign exchange
losses and other financial expenses.
Net interest expense for 2009 was EUR 147 million higher than in 2008,
mainly driven by lower interest rates applied to the liquid assets in
combination with higher interest costs associated with hedging the
Group’s foreign currency funding positions. In 2009, income from the
sale of securities totaled EUR 126 million. This included EUR 69 million
gain from the sale of remaining shares in LG Display, and EUR 48 million
gain from the sale of remaining shares in Pace Micro Technology. These
gains were partially offset by impairment charges amounting to
EUR 58 million, mainly from shareholdings in NXP. Other financial
income in 2009, primarily consisted of a EUR 19 million gain related to
the revaluation of the convertible bonds received from TPV
Technology and CBAY; as well as dividend income totaling EUR 16
million, of which EUR 12 million related to holdings in LG
Display. Other financial expenses included EUR 15 million accretion
expenses mainly associated with discounted asbestos and
environmental provisions.
In 2008, income from the sale of securities totaled EUR 1,406 million.
This included EUR 1,205 million gain from the sale of shares in TSMC,
EUR 158 million gain on the sale of shares in LG Display, and EUR 20
million gain on the sale of shares in D&M. These gains were offset by
impairment charges amounting to EUR 1,148 million. This included
EUR 599 million for NXP, EUR 448 million for LG Display, EUR 71
million for TPO and EUR 30 million for Pace Micro Technology.
Furthermore, other financial expense primarily consisted of a EUR 37
million loss related to the revaluation of the convertible bond received
from TPV Technology. The largest portion of other financial income
was a EUR 23 million dividend from TSMC.
In 2007, income from the sale of securities totaled EUR 2,804 million.
This included EUR 2,783 million gain on the sale of shares in TSMC,
EUR 31 million gain on the sale of shares in Nuance Communications,
and EUR 10 million loss on sale of shares in JDS Uniphase. These gains
were offset by an impairment of EUR 36 million for JDS Uniphase.
Furthermore, other financial income included a EUR 12 million gain
related to the revaluation of the convertible bond received from TPV
Technology and a EUR 128 million cash dividend from TSMC.
4 11 Group financial statements 11.12 - 11.12
178 Philips Annual Report 2009