Philips 2009 Annual Report Download - page 99
Download and view the complete annual report
Please find page 99 of the 2009 Philips annual report below. You can navigate through the pages in the report by either clicking on the pages listed below, or by using the keyword search tool below to find specific information within the annual report.-
 1
1 -
2
-
3
-
4
-
5
-
6
-
7
-
8
-
9
-
10
-
11
-
12
-
13
-
14
-
15
-
16
-
17
-
18
-
19
-
20
-
21
-
22
-
23
-
24
-
25
-
26
-
27
-
28
-
29
-
30
-
31
-
32
-
33
-
34
-
35
-
36
-
37
-
38
-
39
-
40
-
41
-
42
-
43
-
44
-
45
-
46
-
47
-
48
-
49
-
50
-
51
-
52
-
53
-
54
-
55
-
56
-
57
-
58
-
59
-
60
-
61
-
62
-
63
-
64
-
65
-
66
-
67
-
68
-
69
-
70
-
71
-
72
-
73
-
74
-
75
-
76
-
77
-
78
-
79
-
80
-
81
-
82
-
83
-
84
-
85
-
86
-
87
-
88
-
 89
89 -
 90
90 -
 91
91 -
 92
92 -
 93
93 -
 94
94 -
 95
95 -
 96
96 -
 97
97 -
 98
98 -
 99
99 -
 100
100 -
 101
101 -
 102
102 -
 103
103 -
 104
104 -
 105
105 -
 106
106 -
 107
107 -
 108
108 -
 109
109 -
110
-
111
-
112
-
113
-
114
-
115
-
116
-
117
-
118
-
119
-
120
-
121
-
122
-
123
-
124
-
125
-
126
-
127
-
128
-
129
-
130
-
131
-
132
-
133
-
134
-
135
-
136
-
137
-
138
-
139
-
140
-
141
-
142
-
143
-
144
-
145
-
146
-
147
-
148
-
149
-
150
-
151
-
152
-
153
-
154
-
155
-
156
-
157
-
158
-
159
-
160
-
161
-
162
-
163
-
164
-
165
-
166
-
167
-
168
-
169
-
170
-
171
-
172
-
173
-
174
-
175
-
176
-
177
-
178
-
179
-
180
-
181
-
182
-
183
-
184
-
185
-
186
-
187
-
188
-
189
-
190
-
191
-
192
-
193
-
194
-
195
-
196
-
197
-
198
-
199
-
200
-
201
-
202
-
203
-
204
-
205
-
206
-
207
-
208
-
209
-
210
-
211
-
212
-
213
-
214
-
215
-
216
-
217
-
218
-
219
-
220
-
221
-
222
-
223
-
224
-
225
-
226
-
227
-
228
-
229
-
230
-
231
-
232
-
233
-
234
-
235
-
236
-
237
-
238
-
239
-
240
-
241
-
242
-
243
-
244
 |
 |

Cash flow before financing activities improved from an
outflow of EUR 1,143 million in 2008 to an inflow of EUR
591 million, reflecting the impact of cash disbursements of
EUR 1,826 million in 2008, mainly related to the
acquisition of Genlyte. Cash inflow from working capital
improved on 2008, but was largely offset by lower
earnings.
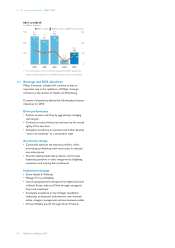
Key data
in millions of euros
2007 2008 2009
Sales 6,321 7,362 6,546
Sales growth
% increase, nominal 12 16 (11)
% increase, comparable1) 7 3 (13)
EBITA1) 738 480 145
as a % of sales 11.7 6.5 2.2
EBIT 664 24 (16)
as a % of sales 10.5 0.3 (0.2)
Net operating capital (NOC)1) 4,050 5,712 5,104
Cash flows before financing
activities1) (625) (1,143) 591
Employees (FTEs) 54,440 57,367 51,653
1) For a reconciliation to the most directly comparable GAAP measures, see
chapter 14, Reconciliation of non-GAAP information, of this Annual Report.
Sales per market cluster
in millions of euros
■-Western Europe--■-North America--■-other mature--■-emerging
8,000
7,000
6,000
5,000
4,000
3,000
2,000
1,000
0
2005
1,889
1,122
300
1,622
4,933
2006
2,096
1,274
347
1,943
5,660
2007
2,524
1,219
308
2,270
6,321
2008
2,665
2,041
276
2,380
7,362
2009
2,271
1,811
253
2,211
6,546
Sales and net operating capital
in billions of euros ■-Sales----NOC
8
6
4
2
0
8
6
4
2
0
2.8
4.9
2005
2.8
5.7
2006
4.1
6.3
2007
5.7
7.4
2008
5.1
6.5
2009
EBIT and EBITA1)
in millions of euros
■-EBIT in value--■
■-EBITA in value----EBITA as a % of sales
800
600
400
200
0
20.0
15.0
10.0
5.0
0
542 3
545
11.0
2005
564
71
635
11.6
2006
664
74
738
11.7
2007
24
456
480
6.5
2008
(16)
161
145
2.2
2009
1) For a reconciliation to the most directly comparable GAAP measures, see
chapter 14, Reconciliation of non-GAAP information, of this Annual Report.
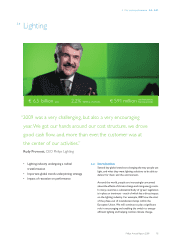
5.4.8 Strategy and 2010 objectives
Philips Lighting will continue to play an important role in
the realization of Philips’ strategic ambitions in the domain
of Health and Well-being.
Lighting has defined the following key business objectives
for 2010:
Drive performance
• Drive our performance through capturing growth while
managing cost and cash
• Win with customers in key markets
• Improve our relative position in emerging markets,
especially China, India and Latin America
Accelerate change
• Further drive the transitions needed to retain the
industry lead in the LED era; optimize the lamps
lifecycle, expand share of leading LED solutions in
professional and consumer segments
• Continue to invest in extending technological
leadership in LED
Implement strategy
• Become the lighting solutions leader in the Outdoor
segment
• Grow our Consumer Luminaires business
• Implement our new Lighting mission, identity and
sustainability story – “Simply enhancing life with light”
5 Our sector performance 5.4.7 - 5.4.8
Philips Annual Report 2009 99