Philips 2009 Annual Report Download - page 60
Download and view the complete annual report
Please find page 60 of the 2009 Philips annual report below. You can navigate through the pages in the report by either clicking on the pages listed below, or by using the keyword search tool below to find specific information within the annual report.-
 1
1 -
2
-
3
-
4
-
5
-
6
-
7
-
8
-
9
-
10
-
11
-
12
-
13
-
14
-
15
-
16
-
17
-
18
-
19
-
20
-
21
-
22
-
23
-
24
-
25
-
26
-
27
-
28
-
29
-
30
-
31
-
32
-
33
-
34
-
35
-
36
-
37
-
38
-
39
-
40
-
41
-
42
-
43
-
44
-
45
-
46
-
47
-
48
-
49
-
 50
50 -
 51
51 -
 52
52 -
 53
53 -
 54
54 -
 55
55 -
 56
56 -
 57
57 -
 58
58 -
 59
59 -
 60
60 -
 61
61 -
 62
62 -
 63
63 -
 64
64 -
 65
65 -
 66
66 -
 67
67 -
 68
68 -
 69
69 -
 70
70 -
71
-
72
-
73
-
74
-
75
-
76
-
77
-
78
-
79
-
80
-
81
-
82
-
83
-
84
-
85
-
86
-
87
-
88
-
89
-
90
-
91
-
92
-
93
-
94
-
95
-
96
-
97
-
98
-
99
-
100
-
101
-
102
-
103
-
104
-
105
-
106
-
107
-
108
-
109
-
110
-
111
-
112
-
113
-
114
-
115
-
116
-
117
-
118
-
119
-
120
-
121
-
122
-
123
-
124
-
125
-
126
-
127
-
128
-
129
-
130
-
131
-
132
-
133
-
134
-
135
-
136
-
137
-
138
-
139
-
140
-
141
-
142
-
143
-
144
-
145
-
146
-
147
-
148
-
149
-
150
-
151
-
152
-
153
-
154
-
155
-
156
-
157
-
158
-
159
-
160
-
161
-
162
-
163
-
164
-
165
-
166
-
167
-
168
-
169
-
170
-
171
-
172
-
173
-
174
-
175
-
176
-
177
-
178
-
179
-
180
-
181
-
182
-
183
-
184
-
185
-
186
-
187
-
188
-
189
-
190
-
191
-
192
-
193
-
194
-
195
-
196
-
197
-
198
-
199
-
200
-
201
-
202
-
203
-
204
-
205
-
206
-
207
-
208
-
209
-
210
-
211
-
212
-
213
-
214
-
215
-
216
-
217
-
218
-
219
-
220
-
221
-
222
-
223
-
224
-
225
-
226
-
227
-
228
-
229
-
230
-
231
-
232
-
233
-
234
-
235
-
236
-
237
-
238
-
239
-
240
-
241
-
242
-
243
-
244
 |
 |

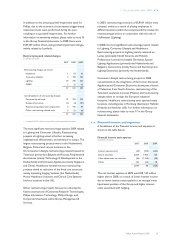
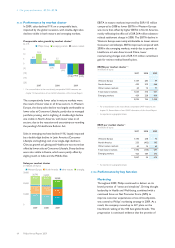
Sales, EBIT and EBITA 2008
in millions of euros unless otherwise stated
sales EBIT % EBITA1) %
Healthcare 7,649 621 8.1 839 11.0
Consumer Lifestyle 10,889 110 1.0 126 1.2
Lighting 7,362 24 0.3 480 6.5
Group Management &
Services 485 (701) − (701) −
Philips Group 26,385 54 0.2 744 2.8
1) For a reconciliation to the most directly comparable GAAP measures, see
chapter 14, Reconciliation of non-GAAP information, of this Annual Report
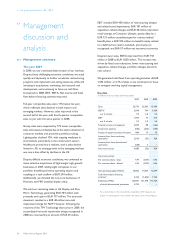
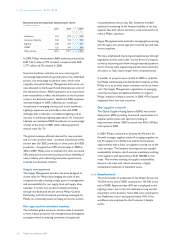
In 2009, EBIT increased by EUR 560 million compared to
2008, to EUR 614 million, or 2.6% of sales. 2009 included
EUR 450 million of restructuring charges, EUR 101 million
of acquisition-related charges, and a EUR 131 million gain
related to curtailment for retiree medical benefit plans.
EBIT in 2008 included a EUR 301 million non-cash
goodwill impairment charge mainly related to Lumileds.
EBIT and EBITA in 2008 were both impacted by a EUR 264
million asbestos-related settlement charge, EUR 541
million of restructuring charges and EUR 131 million of
acquisition-related charges.
Amortization of intangibles, excluding software and
capitalized product development, amounted to EUR 436
million, an increase of EUR 47 million compared with EUR
389 million in 2008.
EBITA increased from EUR 744 million in 2008 to EUR
1,050 million in 2009. Lower EBITA at Lighting was offset
by improved earnings at Consumer Lifestyle, GM&S and
Healthcare. As a percentage of sales, EBITA increased
from 2.8% in 2008 to 4.5% in 2009.
Healthcare
Healthcare’s EBITA of EUR 848 million was EUR 9 million
higher than in 2008 and included EUR 42 million of
restructuring charges and EUR 64 million of acquisition-
related charges. EBITA in 2008 included EUR 63 million of
restructuring charges, EUR 90 million of acquisition-
related charges and a EUR 45 million gain on the sale of
Philips Speech Recognition Services. As a percentage of
sales, EBITA declined from 11.0% in 2008 to 10.8% in
2009.
Consumer Lifestyle
Consumer Lifestyle’s EBITA increased from EUR 126
million in 2008 to EUR 339 million in 2009, mainly as result
of lower non-manufacturing cost. The impact of lower
sales on profitability was largely offset by an improved
gross margin percentage in most businesses, notably
Television, mainly driven by the divestment of Television
in North America and a higher Ambilight share of sales.
EBITA in 2008 included EUR 198 million of restructuring
charges and a EUR 42 million gain on the sale of the Set-
Top Boxes activity. 2009 was impacted by EUR 120 million
of restructuring charges, EUR 48 million of product recall-
related charges and EUR 16 million of acquisition-related
charges. EBITA as a percentage of sales improved from
1.2% in 2008 to 4.0%, driven primarily by portfolio
management and cost control.
Lighting
Lighting’s EBITA declined from EUR 480 million in 2008 to
EUR 145 million. EBITA in 2008 included EUR 245 million
of restructuring charges and EUR 41 million of acquisition-
related and other charges. EBITA in 2009 was impacted by
EUR 225 million of restructuring charges and EUR 22
million of acquisition-related charges. As a percentage of
sales, EBITA declined from 6.5% in 2008 to 2.2% due to
lower sales and margin pressures in most businesses.
Group Management & Services
The EBITA loss at Group Management & Services was
EUR 282 million in 2009, compared to a loss of EUR 701
million in 2008. EBITA in 2008 included a EUR 264 million
asbestos-related settlement charge, whereas 2009 was
mainly impacted by a EUR 131 million gain related to
curtailment for retiree medical benefit plans and EUR 57
million of net asbestos-related recoveries. Restructuring
charges at Group Management & Services in 2009
amounted to EUR 63 million.
For further information regarding the performance of the
sectors, see chapter 5, Our sector performance, of this
Annual Report.
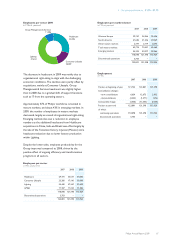
4.1.4 Pensions
The net periodic pension costs of defined-benefit pension
plans amounted to a cost of EUR 3 million in 2009
compared to EUR 21 million credit in 2008, due to lower
expected returns on lower assets in 2009. The defined-
contribution pension cost amounted to EUR 107 million,
EUR 11 million higher than in 2008, mainly due to a gradual
shift from defined-benefit to defined-contribution
pension plans. 2009 included a curtailment gain for retiree
medical benefit plans totaling EUR 131 million. For further
information, refer to note 18 in the Group financial
statements.
4.1.5 Restructuring and impairment charges
In 2009, EBIT included net charges totaling EUR 450
million for restructuring and related asset impairments.
2008 included EUR 541 million of restructuring and
related asset impairment charges.
4 Our group performance 4.1.3 - 4.1.5
60 Philips Annual Report 2009