Philips 2009 Annual Report Download - page 93
Download and view the complete annual report
Please find page 93 of the 2009 Philips annual report below. You can navigate through the pages in the report by either clicking on the pages listed below, or by using the keyword search tool below to find specific information within the annual report.-
 1
1 -
2
-
3
-
4
-
5
-
6
-
7
-
8
-
9
-
10
-
11
-
12
-
13
-
14
-
15
-
16
-
17
-
18
-
19
-
20
-
21
-
22
-
23
-
24
-
25
-
26
-
27
-
28
-
29
-
30
-
31
-
32
-
33
-
34
-
35
-
36
-
37
-
38
-
39
-
40
-
41
-
42
-
43
-
44
-
45
-
46
-
47
-
48
-
49
-
50
-
51
-
52
-
53
-
54
-
55
-
56
-
57
-
58
-
59
-
60
-
61
-
62
-
63
-
64
-
65
-
66
-
67
-
68
-
69
-
70
-
71
-
72
-
73
-
74
-
75
-
76
-
77
-
78
-
79
-
80
-
81
-
82
-
 83
83 -
 84
84 -
 85
85 -
 86
86 -
 87
87 -
 88
88 -
 89
89 -
 90
90 -
 91
91 -
 92
92 -
 93
93 -
 94
94 -
 95
95 -
 96
96 -
 97
97 -
 98
98 -
 99
99 -
 100
100 -
 101
101 -
 102
102 -
 103
103 -
104
-
105
-
106
-
107
-
108
-
109
-
110
-
111
-
112
-
113
-
114
-
115
-
116
-
117
-
118
-
119
-
120
-
121
-
122
-
123
-
124
-
125
-
126
-
127
-
128
-
129
-
130
-
131
-
132
-
133
-
134
-
135
-
136
-
137
-
138
-
139
-
140
-
141
-
142
-
143
-
144
-
145
-
146
-
147
-
148
-
149
-
150
-
151
-
152
-
153
-
154
-
155
-
156
-
157
-
158
-
159
-
160
-
161
-
162
-
163
-
164
-
165
-
166
-
167
-
168
-
169
-
170
-
171
-
172
-
173
-
174
-
175
-
176
-
177
-
178
-
179
-
180
-
181
-
182
-
183
-
184
-
185
-
186
-
187
-
188
-
189
-
190
-
191
-
192
-
193
-
194
-
195
-
196
-
197
-
198
-
199
-
200
-
201
-
202
-
203
-
204
-
205
-
206
-
207
-
208
-
209
-
210
-
211
-
212
-
213
-
214
-
215
-
216
-
217
-
218
-
219
-
220
-
221
-
222
-
223
-
224
-
225
-
226
-
227
-
228
-
229
-
230
-
231
-
232
-
233
-
234
-
235
-
236
-
237
-
238
-
239
-
240
-
241
-
242
-
243
-
244
 |
 |

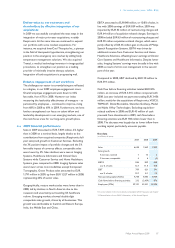
Key data
in millions of euros
2007 2008 2009
Sales 13,102 10,889 8,467
of which Television 6,042 4,724 3,122
Sales growth
% increase (decrease), nominal 2 (17) (22)
% increase (decrease),
comparable1) 4 (9) (17)
Sales growth excl. Television
% increase (decrease), nominal 8 (13) (13)
% increase (decrease),
comparable1) 10 (6) (12)
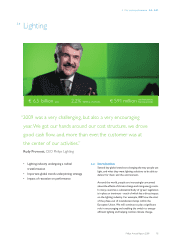
EBITA1) 805 126 339
of which Television (98) (436) (179)
as a % of sales 6.1 1.2 4.0
EBIT 789 110 321
of which Television (98) (436) (179)
as a % of sales 6.0 1.0 3.8
Net operating capital (NOC)1) 1,122 798 625
of which Television (199) (238) (386)
Cash flows before financing
activities1) 714 242 587
of which Television (68) (483) (23)
Employees (FTEs) 23,280 17,145 18,389
of which Television 6,738 4,742 4,766
1) For a reconciliation to the most directly comparable GAAP measures, see
chapter 14, Reconciliation of non-GAAP information, of this Annual Report.
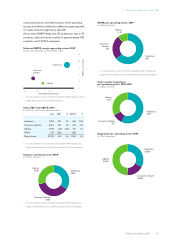
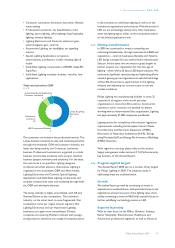
From a geographical perspective, double-digit declines
were visible in all markets. Sales in mature markets, which
accounted for 63% of sales in 2009, fell by 15% due to
sharp declines in both North America and Western
Europe. Sales in key emerging markets suffered double-
digit declines, impacted by lower sales in China, India and
Latin America. Sales in other emerging markets were
below last year’s level due to lower sales in nearly all
countries. Green Product sales totaled EUR 1,915 million,
a nominal increase of 30% compared to 2008, amounting
to 23% of sector sales.
Comparable sales declines were visible in all businesses
except Health & Wellness, which achieved 4% growth.
The largest sales declines were at Television, Audio &
Video Multimedia and Peripherals & Accessories, which all
suffered double-digit declines. Domestic Appliances and
Shaving & Beauty were more resilient, resulting in low
single-digit sales declines.
EBITA improved from EUR 126 million, or 1.2% of sales, in
2008 to EUR 339 million, or 4.0% of sales, in 2009. The
improvement was driven by fixed cost reductions,
portfolio changes at Television and Audio & Video
Multimedia, cost control measures and EUR 78 million
lower restructuring charges which more than offset the
impact of the lower sales, the EUR 48 million product
recall charges and the EUR 42 million gain on the sale of
Set-Top boxes in 2008. Higher EBITA was visible in nearly
all businesses, notably Television and Peripherals &
Accessories.
EBIT amounted to EUR 321 million, or 3.8% of sales,
which included EUR 18 million of amortization of
intangible fixed assets, mainly in Health & Wellness and
Peripherals & Accessories.
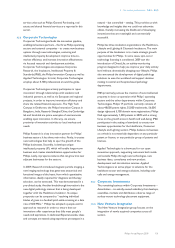
Net operating capital declined by EUR 173 million,
primarily due to rigorous reduction of inventories and
improved accounts receivable management.
Cash flows before financing activities improved from an
inflow of EUR 242 million in 2008 to an inflow of EUR 587
million. The increase was attributable to higher earnings,
higher inflows from working capital and lower capital
expenditures.
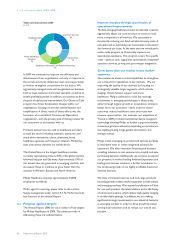
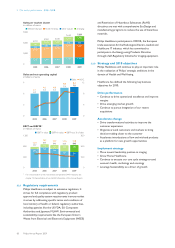
Sales per market cluster
in millions of euros
■-Western Europe--■-North America--■-other mature--■-emerging
16,000
12,000
8,000
4,000
0
2005
5,015
2,920
317
4,206
12,458
2006
5,308
2,939
298
4,369
12,914
2007
5,651
2,623
347
4,481
13,102
2008
4,631
1,741
287
4,230
10,889
2009
4,029
1,072
208
3,158
8,467
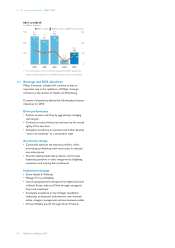
Sales and net operating capital
in billions of euros ■-Sales----NOC
15
12
9
6
3
0
1.5
1.2
0.9
0.6
0.3
0
0.3
12.5
2005
1.1
12.9
2006
1.1
13.1
2007
0.8
10.9
2008
0.6
8.5
2009
5 Our sector performance 5.3.6 - 5.3.6
Philips Annual Report 2009 93