Philips 2009 Annual Report Download - page 127
Download and view the complete annual report
Please find page 127 of the 2009 Philips annual report below. You can navigate through the pages in the report by either clicking on the pages listed below, or by using the keyword search tool below to find specific information within the annual report.-
 1
1 -
2
-
3
-
4
-
5
-
6
-
7
-
8
-
9
-
10
-
11
-
12
-
13
-
14
-
15
-
16
-
17
-
18
-
19
-
20
-
21
-
22
-
23
-
24
-
25
-
26
-
27
-
28
-
29
-
30
-
31
-
32
-
33
-
34
-
35
-
36
-
37
-
38
-
39
-
40
-
41
-
42
-
43
-
44
-
45
-
46
-
47
-
48
-
49
-
50
-
51
-
52
-
53
-
54
-
55
-
56
-
57
-
58
-
59
-
60
-
61
-
62
-
63
-
64
-
65
-
66
-
67
-
68
-
69
-
70
-
71
-
72
-
73
-
74
-
75
-
76
-
77
-
78
-
79
-
80
-
81
-
82
-
83
-
84
-
85
-
86
-
87
-
88
-
89
-
90
-
91
-
92
-
93
-
94
-
95
-
96
-
97
-
98
-
99
-
100
-
101
-
102
-
103
-
104
-
105
-
106
-
107
-
108
-
109
-
110
-
111
-
112
-
113
-
114
-
115
-
116
-
 117
117 -
 118
118 -
 119
119 -
 120
120 -
 121
121 -
 122
122 -
 123
123 -
 124
124 -
 125
125 -
 126
126 -
 127
127 -
 128
128 -
 129
129 -
 130
130 -
 131
131 -
 132
132 -
 133
133 -
 134
134 -
 135
135 -
 136
136 -
 137
137 -
138
-
139
-
140
-
141
-
142
-
143
-
144
-
145
-
146
-
147
-
148
-
149
-
150
-
151
-
152
-
153
-
154
-
155
-
156
-
157
-
158
-
159
-
160
-
161
-
162
-
163
-
164
-
165
-
166
-
167
-
168
-
169
-
170
-
171
-
172
-
173
-
174
-
175
-
176
-
177
-
178
-
179
-
180
-
181
-
182
-
183
-
184
-
185
-
186
-
187
-
188
-
189
-
190
-
191
-
192
-
193
-
194
-
195
-
196
-
197
-
198
-
199
-
200
-
201
-
202
-
203
-
204
-
205
-
206
-
207
-
208
-
209
-
210
-
211
-
212
-
213
-
214
-
215
-
216
-
217
-
218
-
219
-
220
-
221
-
222
-
223
-
224
-
225
-
226
-
227
-
228
-
229
-
230
-
231
-
232
-
233
-
234
-
235
-
236
-
237
-
238
-
239
-
240
-
241
-
242
-
243
-
244
 |
 |

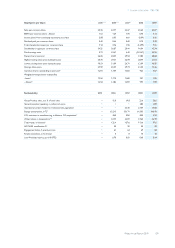
7.8 Five-year overview
All amounts in millions of euros unless otherwise stated. Due to factors such as consolidations and divestments, the amounts,
percentages and ratios are not directly comparable.
General data 20051,2,3) 20061,2,3) 20073) 2008 2009
Sales 25,445 26,682 26,793 26,385 23,189
Percentage increase over previous year 4 5 − (2) (12)
Income (loss) from continuing operations 3,598 1,003 5,018 (95) 424
Discontinued operations (6) 4,154 (138) 3 −
Net income (loss) 3,592 5,157 4,880 (92) 424
Free cash flow 661 (348) 824 773 863
Turnover rate of net operating capital 4.74 3.73 2.71 1.72 1.79
Total employees at year-end (in thousands) 1594) 1224) 1244) 121 116
1) Discontinued operations reflects the effect of the sale of MDS in 2006, for which previous years have been restated
2) Discontinued operations reflects the effect of the sale of Semiconductors in 2006, for which previous years have been restated
3) Discontinued operations reflects the effect of classifying the MedQuist business as a discontinued operation in 2007, for which previous years have been restated
4) Including discontinued operations
5) In millions of shares
6) In manufacturing excluding new acquisitions
Income 20051,2,3) 20061,2,3) 20073) 2008 2009
EBIT 1,810 1,336 1,867 54 614
as a % of sales 7.1 5.0 7.0 0.2 2.6
EBITA 1,899 1,528 2,094 744 1,050
as a % of sales 7.5 5.7 7.8 2.8 4.5
Income taxes (599) (223) (582) (256) (100)
as a % of income before taxes (31.2) (16.3) (12.3) (180.2) (22.3)
Income (loss) from continuing operations 3,598 1,003 5,018 (95) 424
as a % of stockholders’ equity (ROE) 22.3 4.8 22.8 (0.5) 2.9
Net income (loss) 3,592 5,157 4,880 (92) 424
7 Investor information 7.8 - 7.8
Philips Annual Report 2009 127