Philips 2009 Annual Report Download - page 193
Download and view the complete annual report
Please find page 193 of the 2009 Philips annual report below. You can navigate through the pages in the report by either clicking on the pages listed below, or by using the keyword search tool below to find specific information within the annual report.-
 1
1 -
2
-
3
-
4
-
5
-
6
-
7
-
8
-
9
-
10
-
11
-
12
-
13
-
14
-
15
-
16
-
17
-
18
-
19
-
20
-
21
-
22
-
23
-
24
-
25
-
26
-
27
-
28
-
29
-
30
-
31
-
32
-
33
-
34
-
35
-
36
-
37
-
38
-
39
-
40
-
41
-
42
-
43
-
44
-
45
-
46
-
47
-
48
-
49
-
50
-
51
-
52
-
53
-
54
-
55
-
56
-
57
-
58
-
59
-
60
-
61
-
62
-
63
-
64
-
65
-
66
-
67
-
68
-
69
-
70
-
71
-
72
-
73
-
74
-
75
-
76
-
77
-
78
-
79
-
80
-
81
-
82
-
83
-
84
-
85
-
86
-
87
-
88
-
89
-
90
-
91
-
92
-
93
-
94
-
95
-
96
-
97
-
98
-
99
-
100
-
101
-
102
-
103
-
104
-
105
-
106
-
107
-
108
-
109
-
110
-
111
-
112
-
113
-
114
-
115
-
116
-
117
-
118
-
119
-
120
-
121
-
122
-
123
-
124
-
125
-
126
-
127
-
128
-
129
-
130
-
131
-
132
-
133
-
134
-
135
-
136
-
137
-
138
-
139
-
140
-
141
-
142
-
143
-
144
-
145
-
146
-
147
-
148
-
149
-
150
-
151
-
152
-
153
-
154
-
155
-
156
-
157
-
158
-
159
-
160
-
161
-
162
-
163
-
164
-
165
-
166
-
167
-
168
-
169
-
170
-
171
-
172
-
173
-
174
-
175
-
176
-
177
-
178
-
179
-
180
-
181
-
182
-
 183
183 -
 184
184 -
 185
185 -
 186
186 -
 187
187 -
 188
188 -
 189
189 -
 190
190 -
 191
191 -
 192
192 -
 193
193 -
 194
194 -
 195
195 -
 196
196 -
 197
197 -
 198
198 -
 199
199 -
 200
200 -
 201
201 -
 202
202 -
 203
203 -
204
-
205
-
206
-
207
-
208
-
209
-
210
-
211
-
212
-
213
-
214
-
215
-
216
-
217
-
218
-
219
-
220
-
221
-
222
-
223
-
224
-
225
-
226
-
227
-
228
-
229
-
230
-
231
-
232
-
233
-
234
-
235
-
236
-
237
-
238
-
239
-
240
-
241
-
242
-
243
-
244
 |
 |

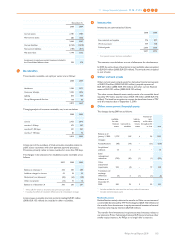
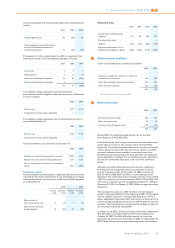
Amounts recognized in the Consolidated statements of comprehensive
income:
2007 2008 2009
Actuarial (gains) losses 50 (49) 63
Total recognized in net periodic pension
cost and Consolidated statements of
comprehensive income 79 (18) (37)
The expense for other postretirement benefits is recognized in the
following line items in the Consolidated statements of income:
2007 2008 2009
Cost of sales 2 4 2
Selling expenses 2 3 (1)
General and administrative expenses 24 24 (101)
Research and development expenses 1 − −
29 31 (100)
The weighted average assumptions used to calculate the
postretirement benefit obligations other than pensions as of December
31 were as follows:
2008 2009
Discount rate 9.7% 6.7%
Compensation increase (where applicable) − −
The weighted average assumptions used to calculate the net cost for
years ended December 31:
2008 2009
Discount rate 8.5% 9.7%
Compensation increase (where applicable) − −
Assumed healthcare cost trend rates at December 31:
2008 2009
Healthcare cost trend rate assumed for next year 10.0% 9.0%
Rate that the cost trend rate will gradually reach 7.5% 5.0%
Year of reaching the rate at which it is assumed to
remain 2016 2018
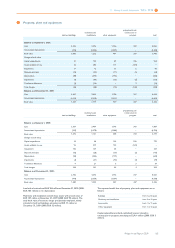
Sensitivity analysis
Assumed healthcare trend rates have a significant effect on the amounts
reported for the retiree medical plans. A one percentage-point change
in assumed healthcare cost trend rates would have the following effects
as at December 31:
2008 2009
increase
of 1%
decrease
of 1%
increase
of 1%
decrease
of 1%
Effect on total of
service and interest cost 5 (4) 1 (1)
Effect on postretirement
benefit obligation 36 (32) 21 (18)
Historical data
2006 2007 2008 2009
Present value of defined-benefit
obligation 373 413 353 295
Fair value of plan assets − − − −
(Deficit) (373) (413) (353) (295)
Experience adjustments in % on
defined-benefit obligations; (gains) (1.6%) (0.2%) (0.1%) (4.9%)
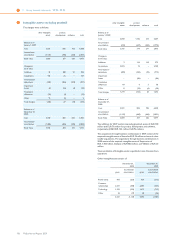
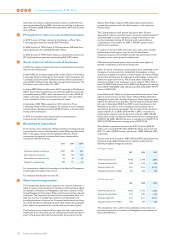
19 Other current liabilities
Other current liabilities are summarized as follows:
2008 2009
Advances received from customers on orders not
covered by work in process 148 243
Other taxes including social security premiums 251 275
Other short-term liabilities1) 243 185
642 703
1) Prior period amount has been reclassified
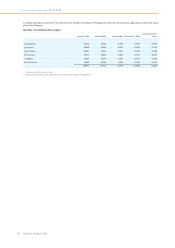
20 Short-term debt
2008 2009
Short-term bank borrowings 562 462
Other short-term loans 24 19
Current portion of long-term debt 136 146
722 627
During 2009, the weighted average interest rate on the bank
borrowings was 8.1% (2008: 8.6%).
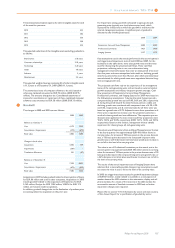
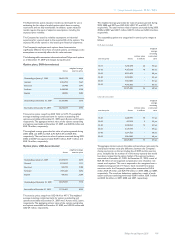
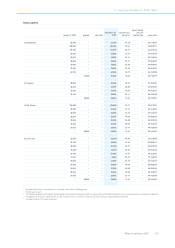
In the Netherlands, the Company issued personnel debentures with a
5-year right of conversion into common shares of Royal Philips
Electronics. Convertible personnel debentures may not be converted
within a period of 3 years after the date of issue. These convertible
personnel debentures were available to most employees in the
Netherlands and were purchased by them with their own funds and
were redeemable on demand. The convertible personnel debentures
become non-convertible debentures at the end of the conversion
period.
Although convertible debentures have the character of long-term
financing, the total outstanding amounts are classified as current
portion of long-term debt. At December 31, 2009, an amount of
EUR 51 million (2008: EUR 72 million) of convertible personnel
debentures was outstanding, with an average conversion price of EUR
22.83. The conversion price varies between EUR 14.19 and EUR 31.59
with various conversion periods ending between January 1, 2010 and
December 31, 2013. As of January 1, 2009, Philips no longer issues these
debentures.
The Company has access to a USD 2.5 billion commercial paper
program which was established at the beginning of 2001. The Company
also has available seven-year revolving credit facilities for USD 2.5
billion, established in December 2004, that could act as back-up for the
commercial paper program and can also be used for general corporate
purposes. The Company did not use the commercial paper program or
the revolving credit facility during 2009.
In addition to the USD 2.5 billion revolving credit facilities, Philips had a
EUR 200 million committed undrawn bilateral loan in place since
October 30, 2009. The EUR 450 million standby roll-over loan
agreement was terminated on November 4, 2009. As of December 31,
2009, Philips did not have any debt outstanding under these facilities.
11 Group financial statements 11.12 - 11.12 19 20
Philips Annual Report 2009 193