Philips 2009 Annual Report Download - page 116
Download and view the complete annual report
Please find page 116 of the 2009 Philips annual report below. You can navigate through the pages in the report by either clicking on the pages listed below, or by using the keyword search tool below to find specific information within the annual report.-
 1
1 -
2
-
3
-
4
-
5
-
6
-
7
-
8
-
9
-
10
-
11
-
12
-
13
-
14
-
15
-
16
-
17
-
18
-
19
-
20
-
21
-
22
-
23
-
24
-
25
-
26
-
27
-
28
-
29
-
30
-
31
-
32
-
33
-
34
-
35
-
36
-
37
-
38
-
39
-
40
-
41
-
42
-
43
-
44
-
45
-
46
-
47
-
48
-
49
-
50
-
51
-
52
-
53
-
54
-
55
-
56
-
57
-
58
-
59
-
60
-
61
-
62
-
63
-
64
-
65
-
66
-
67
-
68
-
69
-
70
-
71
-
72
-
73
-
74
-
75
-
76
-
77
-
78
-
79
-
80
-
81
-
82
-
83
-
84
-
85
-
86
-
87
-
88
-
89
-
90
-
91
-
92
-
93
-
94
-
95
-
96
-
97
-
98
-
99
-
100
-
101
-
102
-
103
-
104
-
105
-
 106
106 -
 107
107 -
 108
108 -
 109
109 -
 110
110 -
 111
111 -
 112
112 -
 113
113 -
 114
114 -
 115
115 -
 116
116 -
 117
117 -
 118
118 -
 119
119 -
 120
120 -
 121
121 -
 122
122 -
 123
123 -
 124
124 -
 125
125 -
 126
126 -
127
-
128
-
129
-
130
-
131
-
132
-
133
-
134
-
135
-
136
-
137
-
138
-
139
-
140
-
141
-
142
-
143
-
144
-
145
-
146
-
147
-
148
-
149
-
150
-
151
-
152
-
153
-
154
-
155
-
156
-
157
-
158
-
159
-
160
-
161
-
162
-
163
-
164
-
165
-
166
-
167
-
168
-
169
-
170
-
171
-
172
-
173
-
174
-
175
-
176
-
177
-
178
-
179
-
180
-
181
-
182
-
183
-
184
-
185
-
186
-
187
-
188
-
189
-
190
-
191
-
192
-
193
-
194
-
195
-
196
-
197
-
198
-
199
-
200
-
201
-
202
-
203
-
204
-
205
-
206
-
207
-
208
-
209
-
210
-
211
-
212
-
213
-
214
-
215
-
216
-
217
-
218
-
219
-
220
-
221
-
222
-
223
-
224
-
225
-
226
-
227
-
228
-
229
-
230
-
231
-
232
-
233
-
234
-
235
-
236
-
237
-
238
-
239
-
240
-
241
-
242
-
243
-
244
 |
 |

As of December 31, 2009, the company had country risk
exposure in the United States of EUR 9 billion and in the
Netherlands of EUR 8 billion. Other countries exceeding
EUR 1 billion but less than EUR 3 billion are China
(including Hong Kong) and Belgium. Countries where the
risk exceeded EUR 500 million but was less than EUR 1
billion are Germany and Japan. Countries where the risk
exceeded EUR 200 million but was less than EUR 500
million are Poland, Italy, Canada and France. The degree of
risk of a country is taken into account when new
investments are considered. The company does not,
however, use financial derivative instruments to hedge
country risk.
Other insurable risks
Philips is covered for a range of different kinds of losses by
global insurance policies in the areas of property damage,
business interruption, general and product liability,
transport, directors’ and officers’ liability, employment
practice liability, fraud, and aviation product liability.
To lower exposures and to avoid potential losses, Philips
has a worldwide Risk Engineering program in place. The
main focus in this program is on property damage and
business interruption risks, which also include
interdependencies. Philips sites, and also a limited number
of sites of key suppliers, are inspected on a regular basis by
the Risk Engineering personnel of the insurer. Inspections
are carried out against predefined Risk Engineering
standards which are agreed between Philips and the
insurers. Recommendations are made in a Risk
Management report and are reviewed centrally. This is the
basis for decision-making by the local management of the
business as to which recommendations will be
implemented. For all policies, deductibles are in place,
which vary from EUR 250,000 to EUR 500,000 per
occurrence and this variance is designed to differentiate
between the existing risk categories within Philips. Above
this first layer of working deductibles, Philips operates its
own re-insurance captive, which during 2009 retained
EUR 2.5 million per occurrence for the property damage
and business interruption losses and EUR 5 million in the
aggregate per year. For general and product liability
claims, the captive retained EUR 1.5 million per claim and
EUR 6 million in the aggregate. New contracts were
signed on December 31, 2009 for the coming year,
whereby the reinsurance captive retentions remained
unchanged.
6.7.3 Details of pension risks
This section further analyzes the pension exposure and
possible risks thereof.
Pension-related exposure to changes in
financial markets
With pension obligations in more than thirty countries,
Philips has devoted considerable attention and resources
to ensuring disclosure, awareness and control of the
resulting exposures.
Depending on the investment policies and the
membership composition of the respective pension funds,
developments in financial markets and changes in life
expectancy may have significant effects on the Funded
Status and net periodic pension costs (NPPC) of Philips’
pension plans. The pension plans in Germany, the
Netherlands, the UK and the US cover approximately 95%
of the Company’s total pension liabilities. To monitor
their exposure to the respective risk factors, Philips uses a
stochastic model. Amongst other things, the model allows
both sensitivity analysis and stochastic simulations of the
pension accounting figures of Philips. The sensitivity
analysis presented and described in this chapter does not
cover funding status or cost analysis on an economic or
regulatory valuation basis.
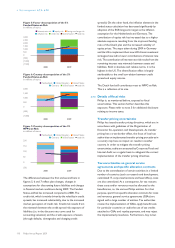
Sensitivity analysis
An indication of Philips’ accounting risk exposures related
to pensions can be obtained by a sensitivity analysis of the
Funded Status and NPPC for the above-mentioned
countries. The bar charts in figures 1 and 2 show the
sensitivities of the Funded Status to changes in equity price
levels, interest rates, inflation expectations and longevity.
Figures 3 and 4 show the same sensitivities for the NPPC.
The changes applied in this analysis represent
approximately one standard deviation and the absolute
numbers of the impact for each factor/assumption are
mentioned in the graphs. The risk numbers show how
much the Funded Status and NPPC change relative to
their (expected) levels at year-end 2010 if equity price
levels, interest rates, inflation expectation and longevity
trend deviate from their (expected) values at the end of
2010.
Figure 1: Sensitivity of funded status to equity
and interest rates
in millions of euros
Impact on funded status
■-Netherlands--■-United States--■-United Kingdom--■-Germany
1,000
750
500
250
0
(250)
(500)
(750)
(1,000) Equity
+20% -20%
Interest rate
+1% -1%
6 Risk management 6.7.2 - 6.7.3
116 Philips Annual Report 2009