Philips 2009 Annual Report Download - page 5
Download and view the complete annual report
Please find page 5 of the 2009 Philips annual report below. You can navigate through the pages in the report by either clicking on the pages listed below, or by using the keyword search tool below to find specific information within the annual report.-
 1
1 -
 2
2 -
 3
3 -
 4
4 -
 5
5 -
 6
6 -
 7
7 -
 8
8 -
 9
9 -
 10
10 -
 11
11 -
 12
12 -
 13
13 -
 14
14 -
 15
15 -
 16
16 -
17
-
18
-
19
-
20
-
21
-
22
-
23
-
24
-
25
-
26
-
27
-
28
-
29
-
30
-
31
-
32
-
33
-
34
-
35
-
36
-
37
-
38
-
39
-
40
-
41
-
42
-
43
-
44
-
45
-
46
-
47
-
48
-
49
-
50
-
51
-
52
-
53
-
54
-
55
-
56
-
57
-
58
-
59
-
60
-
61
-
62
-
63
-
64
-
65
-
66
-
67
-
68
-
69
-
70
-
71
-
72
-
73
-
74
-
75
-
76
-
77
-
78
-
79
-
80
-
81
-
82
-
83
-
84
-
85
-
86
-
87
-
88
-
89
-
90
-
91
-
92
-
93
-
94
-
95
-
96
-
97
-
98
-
99
-
100
-
101
-
102
-
103
-
104
-
105
-
106
-
107
-
108
-
109
-
110
-
111
-
112
-
113
-
114
-
115
-
116
-
117
-
118
-
119
-
120
-
121
-
122
-
123
-
124
-
125
-
126
-
127
-
128
-
129
-
130
-
131
-
132
-
133
-
134
-
135
-
136
-
137
-
138
-
139
-
140
-
141
-
142
-
143
-
144
-
145
-
146
-
147
-
148
-
149
-
150
-
151
-
152
-
153
-
154
-
155
-
156
-
157
-
158
-
159
-
160
-
161
-
162
-
163
-
164
-
165
-
166
-
167
-
168
-
169
-
170
-
171
-
172
-
173
-
174
-
175
-
176
-
177
-
178
-
179
-
180
-
181
-
182
-
183
-
184
-
185
-
186
-
187
-
188
-
189
-
190
-
191
-
192
-
193
-
194
-
195
-
196
-
197
-
198
-
199
-
200
-
201
-
202
-
203
-
204
-
205
-
206
-
207
-
208
-
209
-
210
-
211
-
212
-
213
-
214
-
215
-
216
-
217
-
218
-
219
-
220
-
221
-
222
-
223
-
224
-
225
-
226
-
227
-
228
-
229
-
230
-
231
-
232
-
233
-
234
-
235
-
236
-
237
-
238
-
239
-
240
-
241
-
242
-
243
-
244
 |
 |
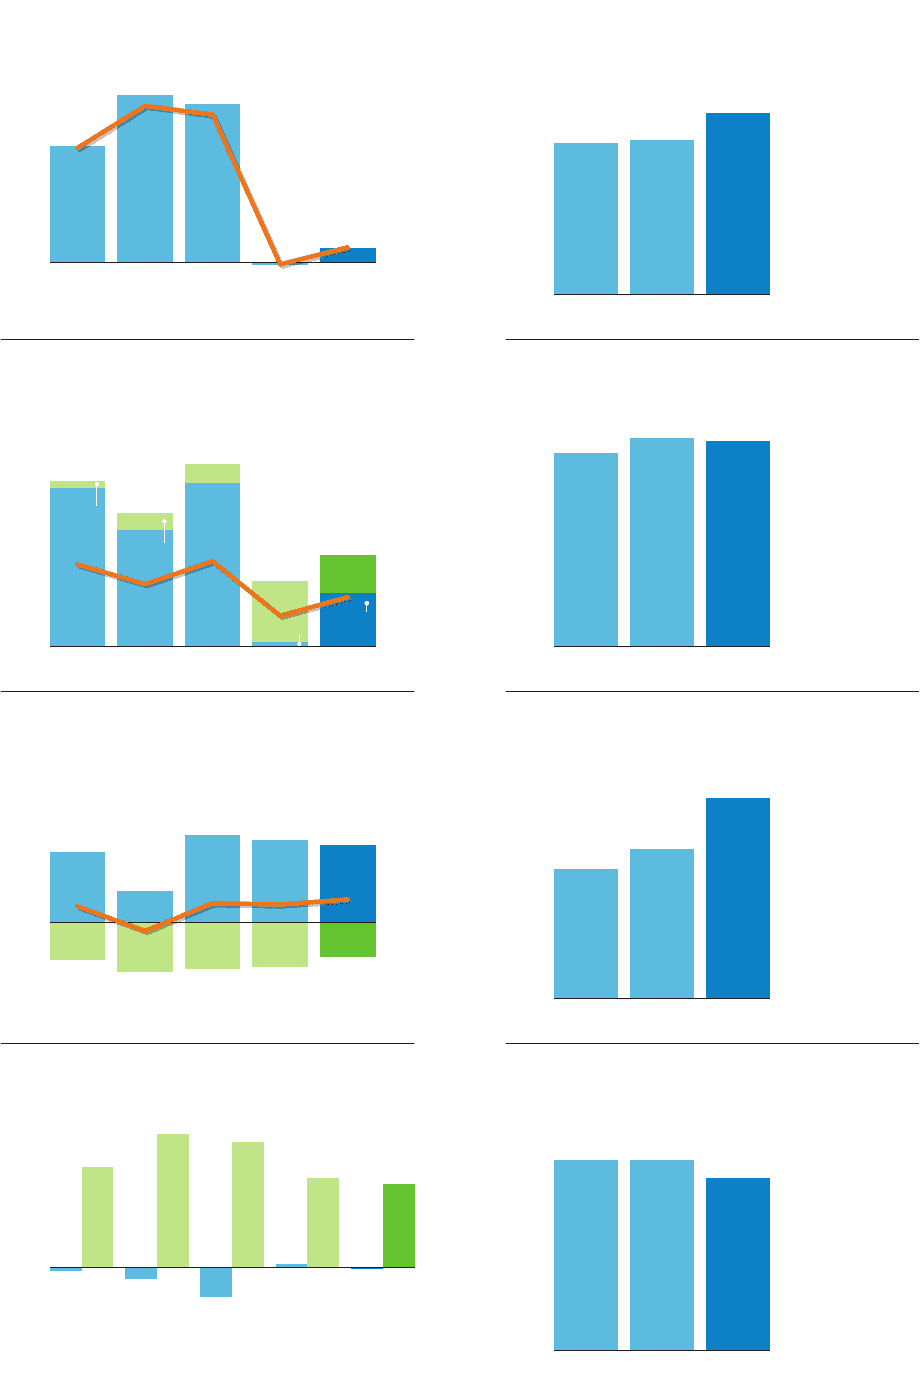
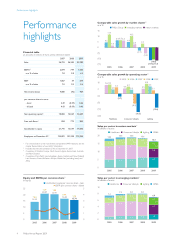
Net income (loss)
in millions of euros ■-in value----as a % of sales
6,000
5,000
4,000
3,000
2,000
1,000
0
(1,000)
24
20
16
12
8
4
0
(4)
14.1
3,592
2005
19.3
5,157
2006
18.2
4,880
2007
(0.3)
(92)
2008
1.8
424
2009
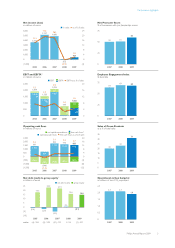
EBIT and EBITA1)
in millions of euros
■-EBIT --■
■-EBITA----EBITA as a % of sales
2,500
2,000
1,500
1,000
500
0
20
16
12
8
4
0
1,810
89
1,899
7.5
2005
1,336
192
1,528
5.7
2006
1,867
227
2,094
7.8
2007
54
690
744
2.8
2008
614
436
1,050
4.5
2009
Operating cash flows
in millions of euros
■-net capital expenditures--■
■-free cash flows1)
■-operating cash flows----free cash flows as a % of sales
2,500
2,000
1,500
1,000
500
0
(500)
(1,000)
(1,500)
20
16
12
8
4
0
(4)
(8)
(12)
1,407
(746)
661
2.6
2005
639
(987)
(348)
(1.3)
2006
1,752
(928)
824
3.1
2007
1,648
(875)
773
2.9
2008
1,545
(682)
863
3.7
2009
Net debt (cash) to group equity1)
in billions of euros ■-net debt (cash)--■-group equity
25
20
15
10
5
0
(5)
(10)
(0.6)
17.5
(4) : 104
2005
(2.0)
23.2
(9) : 109
2006
(5.2)
21.9
(31) : 131
2007
0.6
15.6
4 : 96
2008
(0.1)
14.6
(1) : 101
2009
ratio:
Net Promoter Score
% of businesses with (co-)leadership scores
75
50
25
0
50
2007
51
2008
60
2009
Employee Engagement Index
% favorable
75
50
25
0
64
2007
69
2008
68
2009
Sales of Green Products
as a % of total sales
35
30
25
20
15
10
5
0
20
2007
23
2008
31
2009
Operational carbon footprint
in millions of tons CO2-equivalent
2.5
2.0
1.5
1.0
0.5
0
2.1
2007
2.1
2008
1.9
2009
Performance highlights
Philips Annual Report 2009 5