Philips 2009 Annual Report Download - page 121
Download and view the complete annual report
Please find page 121 of the 2009 Philips annual report below. You can navigate through the pages in the report by either clicking on the pages listed below, or by using the keyword search tool below to find specific information within the annual report.-
 1
1 -
2
-
3
-
4
-
5
-
6
-
7
-
8
-
9
-
10
-
11
-
12
-
13
-
14
-
15
-
16
-
17
-
18
-
19
-
20
-
21
-
22
-
23
-
24
-
25
-
26
-
27
-
28
-
29
-
30
-
31
-
32
-
33
-
34
-
35
-
36
-
37
-
38
-
39
-
40
-
41
-
42
-
43
-
44
-
45
-
46
-
47
-
48
-
49
-
50
-
51
-
52
-
53
-
54
-
55
-
56
-
57
-
58
-
59
-
60
-
61
-
62
-
63
-
64
-
65
-
66
-
67
-
68
-
69
-
70
-
71
-
72
-
73
-
74
-
75
-
76
-
77
-
78
-
79
-
80
-
81
-
82
-
83
-
84
-
85
-
86
-
87
-
88
-
89
-
90
-
91
-
92
-
93
-
94
-
95
-
96
-
97
-
98
-
99
-
100
-
101
-
102
-
103
-
104
-
105
-
106
-
107
-
108
-
109
-
110
-
 111
111 -
 112
112 -
 113
113 -
 114
114 -
 115
115 -
 116
116 -
 117
117 -
 118
118 -
 119
119 -
 120
120 -
 121
121 -
 122
122 -
 123
123 -
 124
124 -
 125
125 -
 126
126 -
 127
127 -
 128
128 -
 129
129 -
 130
130 -
 131
131 -
132
-
133
-
134
-
135
-
136
-
137
-
138
-
139
-
140
-
141
-
142
-
143
-
144
-
145
-
146
-
147
-
148
-
149
-
150
-
151
-
152
-
153
-
154
-
155
-
156
-
157
-
158
-
159
-
160
-
161
-
162
-
163
-
164
-
165
-
166
-
167
-
168
-
169
-
170
-
171
-
172
-
173
-
174
-
175
-
176
-
177
-
178
-
179
-
180
-
181
-
182
-
183
-
184
-
185
-
186
-
187
-
188
-
189
-
190
-
191
-
192
-
193
-
194
-
195
-
196
-
197
-
198
-
199
-
200
-
201
-
202
-
203
-
204
-
205
-
206
-
207
-
208
-
209
-
210
-
211
-
212
-
213
-
214
-
215
-
216
-
217
-
218
-
219
-
220
-
221
-
222
-
223
-
224
-
225
-
226
-
227
-
228
-
229
-
230
-
231
-
232
-
233
-
234
-
235
-
236
-
237
-
238
-
239
-
240
-
241
-
242
-
243
-
244
 |
 |

7.2 The year 2009
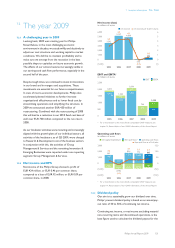
7.2.1 A challenging year in 2009
Looking back, 2009 was a testing year for Philips.
Nevertheless, in the most challenging economic
environment in decades, we acted swiftly and decisively to
adjust our cost structure and working capital to market
conditions. We did this to maintain profitability and to
make sure we emerge from the recession in the best
possible shape to capitalize on future economic growth.
The effects of our actions became increasingly visible in
our earnings and cash flow performance, especially in the
second half of the year.
Despite tough times, we continued to invest in innovation,
in our brand and in mergers and acquisitions. These
investments are essential for our future competitiveness.
In view of macro-economic developments, Philips also
accelerated planned initiatives to further increase
organizational effectiveness and to lower fixed cost by
streamlining operations and simplifying the structure. In
2009 we announced another EUR 450 million of
restructuring. Combined with the restructuring of 2008
this will lead to a reduction in our 2010 fixed cost base of
well over EUR 700 million compared to the run rate in
2008.
As our Incubator activities were maturing and increasingly
aligned with the growth plans of our individual sectors, all
activities of the Incubators, as of Q3 2009, were charged
to Research & Development cost of the business sectors.
In conjunction with this, the activities of Group
Management & Services and the remaining Innovation &
Emerging Businesses were reported under one reporting
segment: Group Management & Services.
7.2.2 Net income and EPS
Net income of the Philips Group showed a profit of
EUR 424 million, or EUR 0.46 per common share,
compared to a loss of EUR 92 million, or EUR 0.09 per
common share, in 2008.
Net income (loss)
in millions of euros
■-net income ----net income per share in euros
6,000
5,000
4,000
3,000
2,000
1,000
0
(1,000)
6
5
4
3
2
1
0
(1)
2.9
3,592
2005
4.4
5,157
2006
4.5
4,880
2007
(0.1)
(92)
2008
0.5
424
2009
EBIT and EBITA1)
in millions of euros ■-EBIT--■
■-EBITA
2,500
2,000
1,500
1,000
500
0
1,810
89
1,899
2005
1,336
192
1,528
2006
1,867
227
2,094
2007
54
690
744
2008
614
436
1,050
2009
1) For a reconciliation to the most directly comparable GAAP measures, see
chapter 14, Reconciliation of non-GAAP information, of this Annual Report
Operating cash flows
in millions of euros
■-net capital expenditure--■
■-free cash flows1)--■-operating cash flows
--free cash flow as a % of sales
3,000
2,000
1,000
0
(1,000)
(2,000)
15.0
10.0
5.0
0
(5.0)
(10.0)
1,407
(746)
661
2.6
2005
639
(987)
(348)
(1.3)
2006
1,752
(928)
824
3.1
2007
1,648
(875)
773
2.9
2008
1,545
(682)
863
3.7
2009
1) For a reconciliation to the most directly comparable GAAP measures, see
chapter 14, Reconciliation of non-GAAP information, of this Annual Report
7.2.3 Dividend policy
Our aim is to sustainably grow our dividend over time.
Philips’ present dividend policy is based on an annual pay-
out ratio of 40 to 50% of continuing net income.
Continuing net income, or net income excluding material
non-recurring items and discontinued operations, is the
base figure used to calculate the dividend payout for the
7 Investor information 7.2 - 7.2.4
Philips Annual Report 2009 121