Philips 2009 Annual Report Download - page 66
Download and view the complete annual report
Please find page 66 of the 2009 Philips annual report below. You can navigate through the pages in the report by either clicking on the pages listed below, or by using the keyword search tool below to find specific information within the annual report.-
 1
1 -
2
-
3
-
4
-
5
-
6
-
7
-
8
-
9
-
10
-
11
-
12
-
13
-
14
-
15
-
16
-
17
-
18
-
19
-
20
-
21
-
22
-
23
-
24
-
25
-
26
-
27
-
28
-
29
-
30
-
31
-
32
-
33
-
34
-
35
-
36
-
37
-
38
-
39
-
40
-
41
-
42
-
43
-
44
-
45
-
46
-
47
-
48
-
49
-
50
-
51
-
52
-
53
-
54
-
55
-
 56
56 -
 57
57 -
 58
58 -
 59
59 -
 60
60 -
 61
61 -
 62
62 -
 63
63 -
 64
64 -
 65
65 -
 66
66 -
 67
67 -
 68
68 -
 69
69 -
 70
70 -
 71
71 -
 72
72 -
 73
73 -
 74
74 -
 75
75 -
 76
76 -
77
-
78
-
79
-
80
-
81
-
82
-
83
-
84
-
85
-
86
-
87
-
88
-
89
-
90
-
91
-
92
-
93
-
94
-
95
-
96
-
97
-
98
-
99
-
100
-
101
-
102
-
103
-
104
-
105
-
106
-
107
-
108
-
109
-
110
-
111
-
112
-
113
-
114
-
115
-
116
-
117
-
118
-
119
-
120
-
121
-
122
-
123
-
124
-
125
-
126
-
127
-
128
-
129
-
130
-
131
-
132
-
133
-
134
-
135
-
136
-
137
-
138
-
139
-
140
-
141
-
142
-
143
-
144
-
145
-
146
-
147
-
148
-
149
-
150
-
151
-
152
-
153
-
154
-
155
-
156
-
157
-
158
-
159
-
160
-
161
-
162
-
163
-
164
-
165
-
166
-
167
-
168
-
169
-
170
-
171
-
172
-
173
-
174
-
175
-
176
-
177
-
178
-
179
-
180
-
181
-
182
-
183
-
184
-
185
-
186
-
187
-
188
-
189
-
190
-
191
-
192
-
193
-
194
-
195
-
196
-
197
-
198
-
199
-
200
-
201
-
202
-
203
-
204
-
205
-
206
-
207
-
208
-
209
-
210
-
211
-
212
-
213
-
214
-
215
-
216
-
217
-
218
-
219
-
220
-
221
-
222
-
223
-
224
-
225
-
226
-
227
-
228
-
229
-
230
-
231
-
232
-
233
-
234
-
235
-
236
-
237
-
238
-
239
-
240
-
241
-
242
-
243
-
244
 |
 |

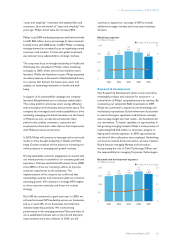
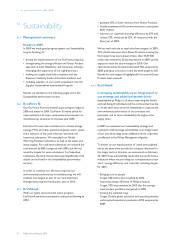
Research and development expenses per sector
in millions of euros
2007 2008 2009
Healthcare 594 672 679
Consumer Lifestyle 504 513 395
Lighting 282 345 351
GM&S 221 247 206
Philips Group 1,601 1,777 1,631
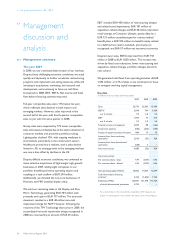
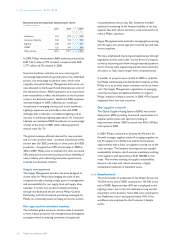
In 2009, Philips’ investment in R&D activities amounted to
EUR 1,631 million (7.0% of sales), compared with EUR
1,777 million (6.7% of sales) in 2008.
Since the Incubator activities are now maturing and
increasingly aligned with the growth plans of our individual
sectors, the early-stage incubation costs, which were
originally covered at Group Management & Services, are
now allocated to the Research and Development costs of
the respective sectors. R&D expenses for prior years have
been reclassified to reflect the allocation of the Incubator
costs to the business sectors. Healthcare R&D expenses
increased slightly in 2009, reflecting our continued
investments in emerging markets and home healthcare.
Lighting’s expenses were broadly in line with 2008,
although with a reduction in traditional lighting and an
increase in solid-state lighting applications. At Consumer
Lifestyle, we maintained R&D investment as a percentage
of sales at the level of 2008, while reducing spend in
mature areas like TV.
The global recession affected demand for new product,
and our new product sales – products introduced within
the last year (for B2C products) or three years (for B2B
products) – dropped from 58% of total sales in 2008 to
48% in 2009. Philips aims to maintain this ratio at around
50%, while at the same time focusing on the profitability of
new products and reallocating innovation spend more
towards new business creation.
Supply management
The Supply Management function has been designed to
create value for Philips by leveraging the scale of the
company, thereby creating a single point of management
and accountability for our supply base and supply chain
activities. It covers non-product-related purchasing
through the dedicated shared service Philips General
Purchasing, and bill-of-material purchasing leveraged for
Philips via commodity teams working across the sectors.
Our approach in turbulent markets
The turbulent global economic climate made it essential
to have in place proactive risk management and mitigation
strategies aimed at ensuring continuity of supply and
competitiveness of sourcing. Our initiatives included
enhanced monitoring of the financial stability of the key
supplier base and, where necessary, early intervention to
reduce Philips’ exposure.
Supply Management also assisted in managing the sourcing
risk through a pro-active approach towards key and sole
source suppliers.
We have emphasized improving competitiveness through
negotiation events, such as the “sooner & more” program,
as well as improving cash flow through extended payment
terms. Various value engineering activities were started in
all sectors to help secure longer-term competitiveness.
A number of projects were started in 2009 to re-define
the Philips warehousing and distribution footprint as One
Philips so as to provide better customer service at lower
cost. The Supply Management organization in emerging
countries has been strengthened further to support
Philips’ ambition in these countries. In 2009, 47% of spend
originated from low-cost countries.
Our supplier network
The Global Supplier Rating System (GSRS) was further
deployed in 2009, providing structured measurement of
supplier performance and rigorous tracking of
improvement actions. GSRS covered over 85% of Philips’
total spend in 2009.
In 2009, Philips continued to develop the Partners for
Growth strategic supplier network, bringing together its
top 36 suppliers to identify and exploit joint business
opportunities with a focus on together coming out of the
crisis stronger. This initiative accompanies our supplier
sustainability initiative, which ensures mandatory auditing
of all suppliers with spend above EUR 100,000 in risk
areas. This involves tracking all supplier sustainability
issues in risk areas and, where necessary, a highly
accelerated resolution of identified issues.
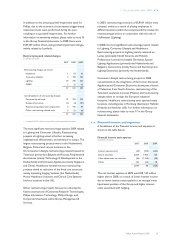
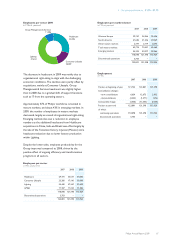
4.1.15 Employment
The total number of employees of the Philips Group was
115,924 at the end of 2009, compared to 121,398 at the
end of 2008. Approximately 45% were employed in the
Lighting sector, due to the still relatively strong vertical
integration in this business. Some 30% were employed in
the Healthcare sector and approximately 16% of the
workforce was employed in the Consumer Lifestyle
sector.
4 Our group performance 4.1.14 - 4.1.15
66 Philips Annual Report 2009