Philips 2009 Annual Report Download - page 59
Download and view the complete annual report
Please find page 59 of the 2009 Philips annual report below. You can navigate through the pages in the report by either clicking on the pages listed below, or by using the keyword search tool below to find specific information within the annual report.-
 1
1 -
2
-
3
-
4
-
5
-
6
-
7
-
8
-
9
-
10
-
11
-
12
-
13
-
14
-
15
-
16
-
17
-
18
-
19
-
20
-
21
-
22
-
23
-
24
-
25
-
26
-
27
-
28
-
29
-
30
-
31
-
32
-
33
-
34
-
35
-
36
-
37
-
38
-
39
-
40
-
41
-
42
-
43
-
44
-
45
-
46
-
47
-
48
-
 49
49 -
 50
50 -
 51
51 -
 52
52 -
 53
53 -
 54
54 -
 55
55 -
 56
56 -
 57
57 -
 58
58 -
 59
59 -
 60
60 -
 61
61 -
 62
62 -
 63
63 -
 64
64 -
 65
65 -
 66
66 -
 67
67 -
 68
68 -
 69
69 -
70
-
71
-
72
-
73
-
74
-
75
-
76
-
77
-
78
-
79
-
80
-
81
-
82
-
83
-
84
-
85
-
86
-
87
-
88
-
89
-
90
-
91
-
92
-
93
-
94
-
95
-
96
-
97
-
98
-
99
-
100
-
101
-
102
-
103
-
104
-
105
-
106
-
107
-
108
-
109
-
110
-
111
-
112
-
113
-
114
-
115
-
116
-
117
-
118
-
119
-
120
-
121
-
122
-
123
-
124
-
125
-
126
-
127
-
128
-
129
-
130
-
131
-
132
-
133
-
134
-
135
-
136
-
137
-
138
-
139
-
140
-
141
-
142
-
143
-
144
-
145
-
146
-
147
-
148
-
149
-
150
-
151
-
152
-
153
-
154
-
155
-
156
-
157
-
158
-
159
-
160
-
161
-
162
-
163
-
164
-
165
-
166
-
167
-
168
-
169
-
170
-
171
-
172
-
173
-
174
-
175
-
176
-
177
-
178
-
179
-
180
-
181
-
182
-
183
-
184
-
185
-
186
-
187
-
188
-
189
-
190
-
191
-
192
-
193
-
194
-
195
-
196
-
197
-
198
-
199
-
200
-
201
-
202
-
203
-
204
-
205
-
206
-
207
-
208
-
209
-
210
-
211
-
212
-
213
-
214
-
215
-
216
-
217
-
218
-
219
-
220
-
221
-
222
-
223
-
224
-
225
-
226
-
227
-
228
-
229
-
230
-
231
-
232
-
233
-
234
-
235
-
236
-
237
-
238
-
239
-
240
-
241
-
242
-
243
-
244
 |
 |

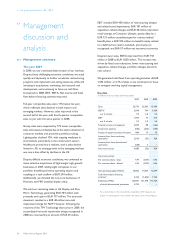
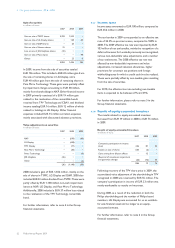
4.1.2 Sales
In percentage terms, the composition of sales growth in
2009, compared to 2008, is presented in the table below.
Sales growth composition 2009 versus 2008
in %
comparable
growth
currency
effects
consolida-
tion
changes
nominal
growth
Healthcare (2.7) 2.6 2.6 2.5
Consumer
Lifestyle (16.5) (0.7) (5.0) (22.2)
Lighting (12.6) 1.0 0.5 (11.1)
GM&S (30.2) (0.1) (0.2) (30.5)
Philips Group (11.4) 0.7 (1.4) (12.1)
Group sales amounted to EUR 23,189 million in 2009, a
12% decline compared to 2008. Adjusted for a favorable
1% currency effect and an unfavorable impact of portfolio
changes, comparable sales were 11% below 2008. The
decline in comparable sales was largely attributable to the
challenging economic environment, particularly in the
consumer markets and in North America.
Consumer Lifestyle reported a 17% comparable sales
decline largely due to weakened consumer markets,
visible in both mature and emerging markets, and selective
portfolio pruning, mainly the exit of certain markets and
products, such as DVD recorders. Comparable sales
declines were seen in all businesses except Health &
Wellness.
Sales at Lighting were 13% lower than in 2008, impacted
by weakness in the commercial construction environment
and automotive market. This resulted in year-on-year
declines in all businesses.
Healthcare sales declined 3% on a comparable basis,
largely impacted by the economic recession and the
uncertainty around healthcare reform in the US. Lower
sales were visible at Healthcare Informatics, Clinical Care
Systems, and Imaging Systems, partly tempered by
moderate growth at Customer Services and Home
Healthcare Solutions.
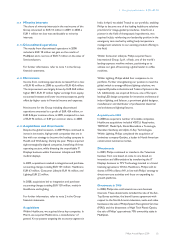
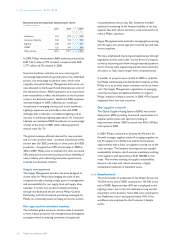
4.1.3 Earnings
In 2009, Philips’ gross margin was EUR 8,079 million, or
34.8% of sales, compared to EUR 8,447 million, or 32.0%
of sales, in 2008. Gross margin in 2009 included
restructuring and acquisition-related charges of EUR 268
million and net asbestos-related recoveries of EUR 57
million. 2008 included EUR 360 million restructuring and
acquisition-related charges and EUR 264 million of
asbestos-related settlement charges. The improvement in
2009 was mainly driven by higher margins at Consumer
Lifestyle, partly offset by declines at Lighting and
Healthcare.
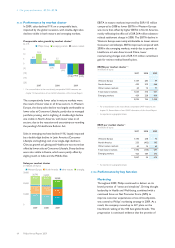
Selling expenses decreased from EUR 5,518 million in
2008 to EUR 5,159 million in 2009. 2008 included EUR
215 million of restructuring and acquisition-related
charges, compared to EUR 185 million in 2009. In relation
to sales, selling expenses increased from 20.9% to 22.2%,
largely due to lower sales levels. This percentage increase
was mainly due to higher costs relative to sales at
Consumer Lifestyle and Lighting, partly offset by
Healthcare.
General and administrative expenses (G&A expenses)
amounted to EUR 734 million, a decrease of EUR 238
million compared to 2008, mainly due to a EUR 131
million curtailment gain for retiree medical benefit plans
and lower restructuring charges in 2009. As a percentage
of sales, G&A expenses decreased from 3.7% in 2008 to
3.2%, driven by the aforementioned items and lower costs
in relation to sales at Consumer Lifestyle and Healthcare,
partly offset by Lighting.
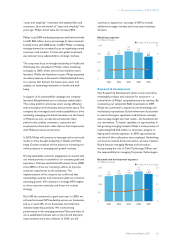
Research and development costs declined from EUR
1,777 million in 2008 to EUR 1,631 million in 2009. 2008
included EUR 40 million of restructuring charges,
compared to EUR 73 million in 2009. The decline in
research and development spend was largely driven by the
lower costs at Consumer Lifestyle, partly offset by higher
costs at Healthcare and Lighting. As a percentage of sales,
research and development costs increased from 6.7% to
7.0%, largely due to Lighting.
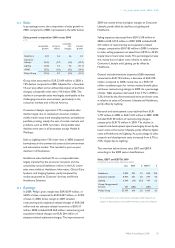
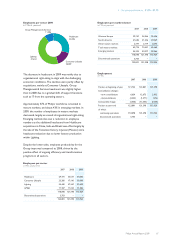
The overview below shows sales, EBIT and EBITA
according to the 2009 sector classifications.
Sales, EBIT and EBITA 2009
in millions of euros unless otherwise stated
sales EBIT % EBITA1) %
Healthcare 7,839 591 7.5 848 10.8
Consumer Lifestyle 8,467 321 3.8 339 4.0
Lighting 6,546 (16) (0.2) 145 2.2
Group Management &
Services 337 (282) − (282) −
Philips Group 23,189 614 2.6 1,050 4.5
1) For a reconciliation to the most directly comparable GAAP measures, see
chapter 14, Reconciliation of non-GAAP information, of this Annual Report.
4 Our group performance 4.1.2 - 4.1.3
Philips Annual Report 2009 59