Philips 2009 Annual Report Download - page 156
Download and view the complete annual report
Please find page 156 of the 2009 Philips annual report below. You can navigate through the pages in the report by either clicking on the pages listed below, or by using the keyword search tool below to find specific information within the annual report.-
 1
1 -
2
-
3
-
4
-
5
-
6
-
7
-
8
-
9
-
10
-
11
-
12
-
13
-
14
-
15
-
16
-
17
-
18
-
19
-
20
-
21
-
22
-
23
-
24
-
25
-
26
-
27
-
28
-
29
-
30
-
31
-
32
-
33
-
34
-
35
-
36
-
37
-
38
-
39
-
40
-
41
-
42
-
43
-
44
-
45
-
46
-
47
-
48
-
49
-
50
-
51
-
52
-
53
-
54
-
55
-
56
-
57
-
58
-
59
-
60
-
61
-
62
-
63
-
64
-
65
-
66
-
67
-
68
-
69
-
70
-
71
-
72
-
73
-
74
-
75
-
76
-
77
-
78
-
79
-
80
-
81
-
82
-
83
-
84
-
85
-
86
-
87
-
88
-
89
-
90
-
91
-
92
-
93
-
94
-
95
-
96
-
97
-
98
-
99
-
100
-
101
-
102
-
103
-
104
-
105
-
106
-
107
-
108
-
109
-
110
-
111
-
112
-
113
-
114
-
115
-
116
-
117
-
118
-
119
-
120
-
121
-
122
-
123
-
124
-
125
-
126
-
127
-
128
-
129
-
130
-
131
-
132
-
133
-
134
-
135
-
136
-
137
-
138
-
139
-
140
-
141
-
142
-
143
-
144
-
145
-
 146
146 -
 147
147 -
 148
148 -
 149
149 -
 150
150 -
 151
151 -
 152
152 -
 153
153 -
 154
154 -
 155
155 -
 156
156 -
 157
157 -
 158
158 -
 159
159 -
 160
160 -
 161
161 -
 162
162 -
 163
163 -
 164
164 -
 165
165 -
 166
166 -
167
-
168
-
169
-
170
-
171
-
172
-
173
-
174
-
175
-
176
-
177
-
178
-
179
-
180
-
181
-
182
-
183
-
184
-
185
-
186
-
187
-
188
-
189
-
190
-
191
-
192
-
193
-
194
-
195
-
196
-
197
-
198
-
199
-
200
-
201
-
202
-
203
-
204
-
205
-
206
-
207
-
208
-
209
-
210
-
211
-
212
-
213
-
214
-
215
-
216
-
217
-
218
-
219
-
220
-
221
-
222
-
223
-
224
-
225
-
226
-
227
-
228
-
229
-
230
-
231
-
232
-
233
-
234
-
235
-
236
-
237
-
238
-
239
-
240
-
241
-
242
-
243
-
244
 |
 |

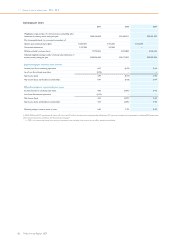
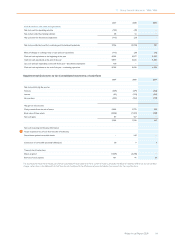
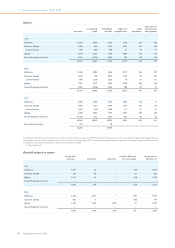
Earnings per share
2007 2008 2009
Weighted average number of common shares outstanding (after
deduction of treasury stock) during the year 1,086,128,418 991,420,017 925,481,395
Plus incremental shares from assumed conversions of:
Options and restricted share rights 11,669,275 5,191,635 3,555,559
Convertible debentures 1,127,690 102,249 −
Dilutive potential common shares 12,796,965 5,293,884 3,555,559
Adjusted weighted average number of shares (after deduction of
treasury stock) during the year 1,098,925,383 996,713,901 929,036,954
Basic earnings per common share in euros
Income (loss) from continuing operations 4.61 (0.09) 0.46
Loss from discontinued operations (0.12) − −
Net income (loss) 4.49 (0.09) 0.46
Net income (loss) attributable to stockholders 4.49 (0.09) 0.44
Diluted earnings per common share in euros
Income (loss) from continuing operations 4.56 (0.09)1) 0.46
Loss from discontinued operations (0.13) −1) −
Net income (loss) 4.43 (0.09)1) 0.46
Net income (loss) attributable to stockholders 4.43 (0.09)1) 0.44
Dividend paid per common share in euros 0.60 0.70 0.70
In 2009, 2008 and 2007, respectively 52 million, 48 million and 27 million securities that could potentially dilute basic EPS were not included in the computation of dilutive EPS because the
effect would have been antidilutive for the periods presented.
1) In 2008, the incremental shares from assumed conversion are not taken into account as the effect would be antidilutive.
11 Group financial statements 11.5 - 11.5
156 Philips Annual Report 2009