Philips 2009 Annual Report Download - page 192
Download and view the complete annual report
Please find page 192 of the 2009 Philips annual report below. You can navigate through the pages in the report by either clicking on the pages listed below, or by using the keyword search tool below to find specific information within the annual report.-
 1
1 -
2
-
3
-
4
-
5
-
6
-
7
-
8
-
9
-
10
-
11
-
12
-
13
-
14
-
15
-
16
-
17
-
18
-
19
-
20
-
21
-
22
-
23
-
24
-
25
-
26
-
27
-
28
-
29
-
30
-
31
-
32
-
33
-
34
-
35
-
36
-
37
-
38
-
39
-
40
-
41
-
42
-
43
-
44
-
45
-
46
-
47
-
48
-
49
-
50
-
51
-
52
-
53
-
54
-
55
-
56
-
57
-
58
-
59
-
60
-
61
-
62
-
63
-
64
-
65
-
66
-
67
-
68
-
69
-
70
-
71
-
72
-
73
-
74
-
75
-
76
-
77
-
78
-
79
-
80
-
81
-
82
-
83
-
84
-
85
-
86
-
87
-
88
-
89
-
90
-
91
-
92
-
93
-
94
-
95
-
96
-
97
-
98
-
99
-
100
-
101
-
102
-
103
-
104
-
105
-
106
-
107
-
108
-
109
-
110
-
111
-
112
-
113
-
114
-
115
-
116
-
117
-
118
-
119
-
120
-
121
-
122
-
123
-
124
-
125
-
126
-
127
-
128
-
129
-
130
-
131
-
132
-
133
-
134
-
135
-
136
-
137
-
138
-
139
-
140
-
141
-
142
-
143
-
144
-
145
-
146
-
147
-
148
-
149
-
150
-
151
-
152
-
153
-
154
-
155
-
156
-
157
-
158
-
159
-
160
-
161
-
162
-
163
-
164
-
165
-
166
-
167
-
168
-
169
-
170
-
171
-
172
-
173
-
174
-
175
-
176
-
177
-
178
-
179
-
180
-
181
-
 182
182 -
 183
183 -
 184
184 -
 185
185 -
 186
186 -
 187
187 -
 188
188 -
 189
189 -
 190
190 -
 191
191 -
 192
192 -
 193
193 -
 194
194 -
 195
195 -
 196
196 -
 197
197 -
 198
198 -
 199
199 -
 200
200 -
 201
201 -
 202
202 -
203
-
204
-
205
-
206
-
207
-
208
-
209
-
210
-
211
-
212
-
213
-
214
-
215
-
216
-
217
-
218
-
219
-
220
-
221
-
222
-
223
-
224
-
225
-
226
-
227
-
228
-
229
-
230
-
231
-
232
-
233
-
234
-
235
-
236
-
237
-
238
-
239
-
240
-
241
-
242
-
243
-
244
 |
 |

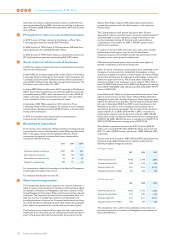
Cash flows and costs in 2010
Philips expects considerable cash outflows in relation to employee
benefits which are estimated to amount to EUR 425 million in 2010,
consisting of EUR 237 million employer contributions to defined-
benefit pension plans, EUR 103 million employer contributions to
defined-contribution pension plans, EUR 59 million expected cash
outflows in relation to unfunded pension plans and EUR 26 million in
relation to unfunded retiree medical plans. The employer contributions
to defined-benefit pension plans are expected to amount to EUR 145
million for the Netherlands and EUR 92 million for other countries. The
Company is reviewing the future funding of the existing deficits in its
pension plans in the US and UK.
The cost for 2010 is expected to amount to EUR 131 million, consisting
of EUR 10 million for defined-benefit pension plans, EUR 103 million for
defined-contribution pension plans and EUR 18 million for defined-
benefit retiree medical plans.
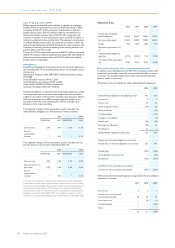
Assumptions
A significant demographic assumption used in the actuarial valuations is
the mortality table. The mortality tables used for the Company’s major
schemes are:
Netherlands: Prognosis table 2005-2050 including experience rating
WW2008
United Kingdom retirees: PA 92 C 2017
United Kingdom non-retirees: PA 92 C 2027
United States: RP2000 CH Fully Generational
Germany: Richttafeln 2005 G.K. Heubeck
The Expected Return on Assets for any funded plan equals the average
of the expected returns per asset class weighted by their portfolio
weights in accordance with the fund’s strategic asset allocation. Where
liability-driven investment (LDI) strategies apply the weights are in
accordance with the actual matching part and the strategic asset
allocation of the return portfolio.
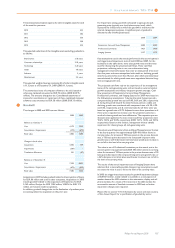
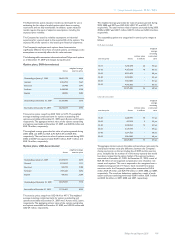
The weighted averages of the assumptions used to calculate the
defined-benefit obligations as of December 31 were as follows:
2008 2009
Netherlands other Netherlands other
Discount rate 5.3% 6.0% 5.0% 5.7%
Rate of
compensation
increase * 3.4% * 4.1%
The weighted averages of the assumptions used to calculate the net
periodic pension cost for years ended December 31:
2008 2009
Netherlands other Netherlands other
Discount rate 4.8% 5.6% 5.3% 6.0%
Expected returns on
plan assets 5.7% 6.4% 5.9% 6.8%
Rate of
compensation
increase * 3.9% * 3.4%
* The rate of compensation increase for the Netherlands consists of a general
compensation increase and an individual salary increase based on merit, seniority
and promotion. The average individual salary increase for all active participants for
the remaining working lifetime is 0.75% annually. The assumed rate of general
compensation increase for the Netherlands for calculating the projected benefit
obligations amounts to 2.0% (2008: 2.0%). The indexation assumption used to
calculate the projected benefit obligations for the Netherlands is 1.0% (2008: 1.0%).
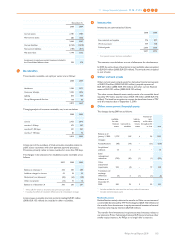
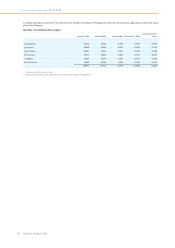
Historical data
2006 2007 2008 2009
Present value of defined-
benefit obligations 20,410 18,679 16,846 17,720
Fair value of plan assets 21,352 20,200 17,899 18,470
Surplus 942 1,521 1,053 750
Experience adjustments in %
on:
- defined-benefit obligations
(gain) loss (0.9%) (0.8%) 1.2% (0.9%)
- fair value of plan assets (gain)
loss 0.8% 2.8% 10.9% (0.6%)
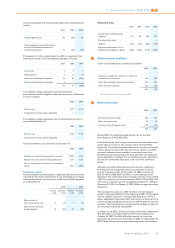
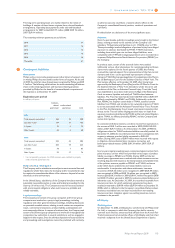
Defined-benefit plans: other postretirement benefits
In addition to providing pension benefits, the Company provides other
postretirement benefits, primarily retiree medical benefits, in certain
countries. The Company funds those other postretirement benefit
plans as claims are incurred.
Movements in the net liability for other defined-benefit obligations:
2008 2009
Defined-benefit obligation at the beginning of year 413 353
Service cost 3 2
Interest cost 34 32
Actuarial (gains) or losses (49) 63
Plan amendments − (21)
Curtailment gains − (134)
Changes in consolidation − (6)
Benefits paid (24) (25)
Exchange rate differences (36) 31
Miscellaneous 12 −
Defined-benefit obligation at end of year 353 295
Present value of funded obligations at end of year − −
Present value of unfunded obligations at end of year 353 295
Funded status (353) (295)
Unrecognized prior-service cost 1 (22)
Net balances (352) (317)
Classification of the net balance is as follows:
Provision for other postretirement benefits (352) (317)
Other postretirement benefit expense recognized in the Consolidated
statements of income:
2007 2008 2009
Service cost 3 3 2
Interest cost on accumulated
postretirement benefits 26 34 32
Prior-service cost − (6) (1)
Curtailment gains − − (134)
Other − − 1
29 31 (100)
11 Group financial statements 11.12 - 11.12
192 Philips Annual Report 2009