Philips 2009 Annual Report Download - page 64
Download and view the complete annual report
Please find page 64 of the 2009 Philips annual report below. You can navigate through the pages in the report by either clicking on the pages listed below, or by using the keyword search tool below to find specific information within the annual report.-
 1
1 -
2
-
3
-
4
-
5
-
6
-
7
-
8
-
9
-
10
-
11
-
12
-
13
-
14
-
15
-
16
-
17
-
18
-
19
-
20
-
21
-
22
-
23
-
24
-
25
-
26
-
27
-
28
-
29
-
30
-
31
-
32
-
33
-
34
-
35
-
36
-
37
-
38
-
39
-
40
-
41
-
42
-
43
-
44
-
45
-
46
-
47
-
48
-
49
-
50
-
51
-
52
-
53
-
 54
54 -
 55
55 -
 56
56 -
 57
57 -
 58
58 -
 59
59 -
 60
60 -
 61
61 -
 62
62 -
 63
63 -
 64
64 -
 65
65 -
 66
66 -
 67
67 -
 68
68 -
 69
69 -
 70
70 -
 71
71 -
 72
72 -
 73
73 -
 74
74 -
75
-
76
-
77
-
78
-
79
-
80
-
81
-
82
-
83
-
84
-
85
-
86
-
87
-
88
-
89
-
90
-
91
-
92
-
93
-
94
-
95
-
96
-
97
-
98
-
99
-
100
-
101
-
102
-
103
-
104
-
105
-
106
-
107
-
108
-
109
-
110
-
111
-
112
-
113
-
114
-
115
-
116
-
117
-
118
-
119
-
120
-
121
-
122
-
123
-
124
-
125
-
126
-
127
-
128
-
129
-
130
-
131
-
132
-
133
-
134
-
135
-
136
-
137
-
138
-
139
-
140
-
141
-
142
-
143
-
144
-
145
-
146
-
147
-
148
-
149
-
150
-
151
-
152
-
153
-
154
-
155
-
156
-
157
-
158
-
159
-
160
-
161
-
162
-
163
-
164
-
165
-
166
-
167
-
168
-
169
-
170
-
171
-
172
-
173
-
174
-
175
-
176
-
177
-
178
-
179
-
180
-
181
-
182
-
183
-
184
-
185
-
186
-
187
-
188
-
189
-
190
-
191
-
192
-
193
-
194
-
195
-
196
-
197
-
198
-
199
-
200
-
201
-
202
-
203
-
204
-
205
-
206
-
207
-
208
-
209
-
210
-
211
-
212
-
213
-
214
-
215
-
216
-
217
-
218
-
219
-
220
-
221
-
222
-
223
-
224
-
225
-
226
-
227
-
228
-
229
-
230
-
231
-
232
-
233
-
234
-
235
-
236
-
237
-
238
-
239
-
240
-
241
-
242
-
243
-
244
 |
 |

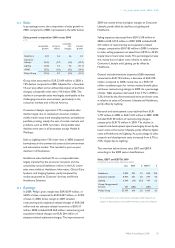
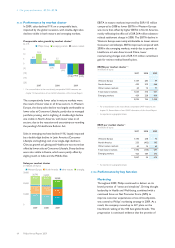
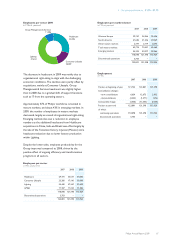
4.1.13 Performance by market cluster
In 2009, sales declined 11% on a comparable basis,
impacted by the global recession, with double-digit sales
declines visible in both mature and emerging markets.
Comparable sales growth by market cluster1)
as a % ■-Philips Group--■-emerging markets--■-mature markets
15
10
5
0
(5)
(10)
(15)
(20)
4.9
10.2
2.8
2007
(2.7)
3.5
(5.4)
2008
(11.4) (10.8) (11.7)
2009
1) For a reconciliation to the most directly comparable GAAP measures, see
chapter 14, Reconciliation of non-GAAP information, of this Annual Report.
The comparatively lower sales in mature markets were
the result of lower sales in all three sectors. In Western
Europe, the sharp sales decline was largely attributable to
lower sales at Consumer Lifestyle, partly due to managed
portfolio pruning, and in Lighting. A double-digit decline
was visible in North America, with lower sales in all
sectors, due to the recession and uncertainty surrounding
the pending US Healthcare Reform Act.
Sales in emerging markets declined 11%, largely impacted
by a double-digit decline in Latin America (Consumer
Lifestyle and Lighting) and a low single-digit decline in
China as growth at Lighting and Healthcare was more than
offset by lower sales at Consumer Lifestyle. Sharp declines
were also visible in Russia, which were partly offset by
slight growth in India and the Middle East.
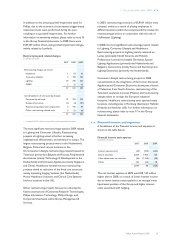
Sales per market cluster
in millions of euros
■-Western Europe--■-North America--■-other mature--■-emerging
30,000
20,000
10,000
0
2007
10,275
7,147
1,331
8,040
26,793
2008
9,518
7,577
1,269
8,021
26,385
2009
8,431
6,597
1,252
6,909
23,189
EBITA in mature markets improved by EUR 115 million
compared to 2008 as lower EBITA in Western Europe
was more than offset by higher EBITA in North America,
mainly reflecting the effect of a EUR 264 million asbestos-
related settlement charge in 2008. The EBITA decline in
Western Europe was mainly attributable to lower sales at
Consumer and Lifestyle. EBITA improved compared with
2008 in the emerging markets, mainly due to growth at
Healthcare in Latin America and China, lower
restructuring charges and a EUR 131 million curtailment
gain for retiree medical benefit plans.
EBITA per market cluster1,2)
in millions of euros
2007 2008 2009
Western Europe 1,169 283 94
North America 433 219 466
Other mature markets 63 14 71
Total mature markets 1,665 516 631
Emerging markets 429 228 419
2,094 744 1,050
1) For a reconciliation to the most directly comparable GAAP measures, see
chapter 14, Reconciliation of non-GAAP information, of this Annual Report
2) As reported on a geographical basis
EBIT per market cluster1)
in millions of euros
2007 2008 2009
Western Europe 1,146 258 73
North America 233 (402) 105
Other mature markets 63 14 63
Total mature markets 1,442 (130) 241
Emerging markets 425 184 373
1,867 54 614
1) As reported on a geographical basis
4.1.14 Performance by key function
Marketing
Throughout 2009, Philips continued to deliver on its
brand promise of “sense and simplicity”. Driving thought
leadership in Health and Well-being, combined with a
continued focus on Net Promoter Score (NPS) to
improve customer experiences across all touchpoints,
was central to Philips’ marketing strategy in 2009. As a
result, the company moved up to 42nd place on the
Interbrand ranking of the 100 best global brands. This
progression is continued evidence that the promise of
4 Our group performance 4.1.13 - 4.1.14
64 Philips Annual Report 2009