Philips 2009 Annual Report Download - page 70
Download and view the complete annual report
Please find page 70 of the 2009 Philips annual report below. You can navigate through the pages in the report by either clicking on the pages listed below, or by using the keyword search tool below to find specific information within the annual report.-
 1
1 -
2
-
3
-
4
-
5
-
6
-
7
-
8
-
9
-
10
-
11
-
12
-
13
-
14
-
15
-
16
-
17
-
18
-
19
-
20
-
21
-
22
-
23
-
24
-
25
-
26
-
27
-
28
-
29
-
30
-
31
-
32
-
33
-
34
-
35
-
36
-
37
-
38
-
39
-
40
-
41
-
42
-
43
-
44
-
45
-
46
-
47
-
48
-
49
-
50
-
51
-
52
-
53
-
54
-
55
-
56
-
57
-
58
-
59
-
 60
60 -
 61
61 -
 62
62 -
 63
63 -
 64
64 -
 65
65 -
 66
66 -
 67
67 -
 68
68 -
 69
69 -
 70
70 -
 71
71 -
 72
72 -
 73
73 -
 74
74 -
 75
75 -
 76
76 -
 77
77 -
 78
78 -
 79
79 -
 80
80 -
81
-
82
-
83
-
84
-
85
-
86
-
87
-
88
-
89
-
90
-
91
-
92
-
93
-
94
-
95
-
96
-
97
-
98
-
99
-
100
-
101
-
102
-
103
-
104
-
105
-
106
-
107
-
108
-
109
-
110
-
111
-
112
-
113
-
114
-
115
-
116
-
117
-
118
-
119
-
120
-
121
-
122
-
123
-
124
-
125
-
126
-
127
-
128
-
129
-
130
-
131
-
132
-
133
-
134
-
135
-
136
-
137
-
138
-
139
-
140
-
141
-
142
-
143
-
144
-
145
-
146
-
147
-
148
-
149
-
150
-
151
-
152
-
153
-
154
-
155
-
156
-
157
-
158
-
159
-
160
-
161
-
162
-
163
-
164
-
165
-
166
-
167
-
168
-
169
-
170
-
171
-
172
-
173
-
174
-
175
-
176
-
177
-
178
-
179
-
180
-
181
-
182
-
183
-
184
-
185
-
186
-
187
-
188
-
189
-
190
-
191
-
192
-
193
-
194
-
195
-
196
-
197
-
198
-
199
-
200
-
201
-
202
-
203
-
204
-
205
-
206
-
207
-
208
-
209
-
210
-
211
-
212
-
213
-
214
-
215
-
216
-
217
-
218
-
219
-
220
-
221
-
222
-
223
-
224
-
225
-
226
-
227
-
228
-
229
-
230
-
231
-
232
-
233
-
234
-
235
-
236
-
237
-
238
-
239
-
240
-
241
-
242
-
243
-
244
 |
 |
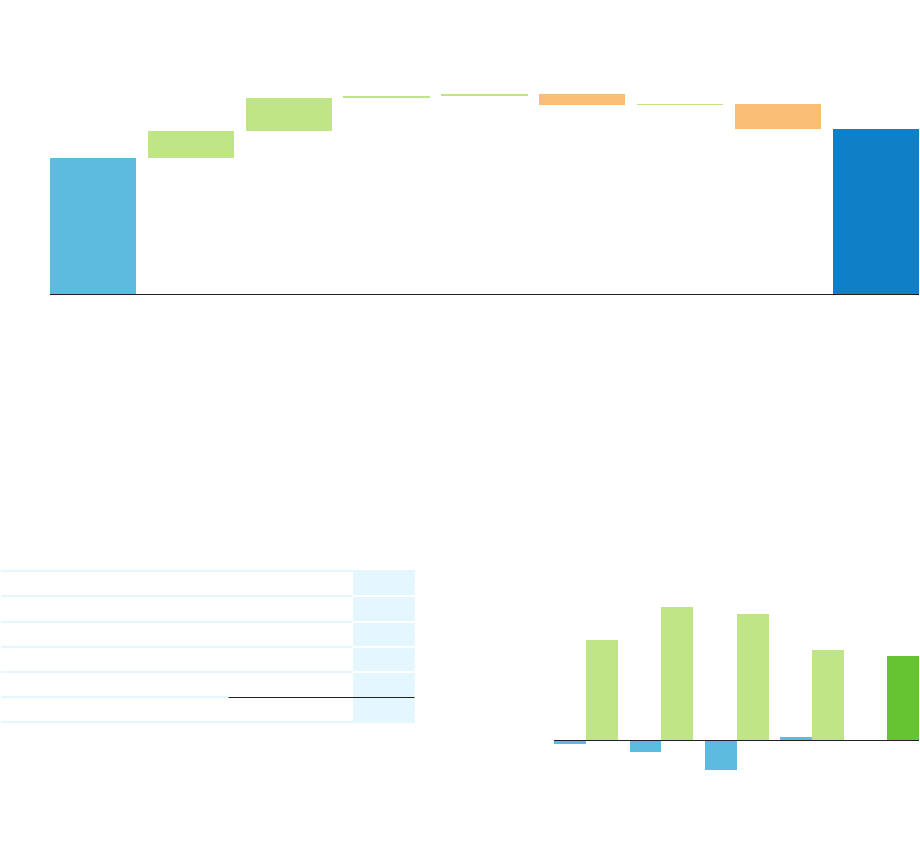
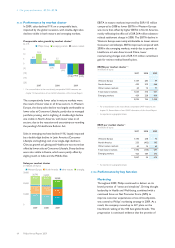
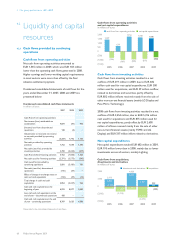
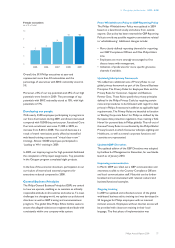
Cash balance movements in 2009
in millions of euros
6,000
4,000
2,000
0
3,620
2008
718
Sale of stakes1)
863
Free cash flow
43
Other
60
Debt
(300)
Acquisitions2)
29
Treasury
share delivery
(647)
Dividend
4,386
2009
1) Includes the sale of stakes in mainly LG Display and Pace Micro Technology
2) Includes the acquisitions of mainly Saeco and Dynalite
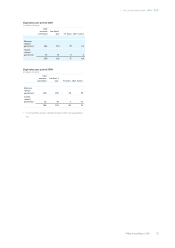
4.2.5 Debt position
Total debt outstanding at the end of 2009 was EUR 4,267
million, compared with EUR 4,188 million at the end of
2008.
Changes in debt
in millions of euros
2007 2008 2009
New borrowings (29) (2,088) (312)
Repayments 313 1,708 252
Consolidation and currency effects 31 (245) (19)
Total changes in debt 315 (625) (79)
In 2009, total debt increased by EUR 79 million. In January,
Philips drew upon a EUR 250 million bank loan. The
increase in other borrowings including finance leases was
EUR 62 million. Repayments under capital leases
amounted to EUR 42 million, while EUR 9 million was
used to reduce other long-term debt. Furthermore Philips
repaid EUR 201 million of short-term debt. Other changes
resulting from consolidation and currency effects led to an
increase of EUR 19 million.
In 2008, total debt increased by EUR 625 million. During
the year, Philips issued EUR 2,053 million of corporate
bonds and repaid EUR 1,691 million of bonds. New
borrowings under capital leases totaled EUR 31 million
and repayments under capital leases amounted to EUR 28
million in the year. Remaining EUR 5 million was used to
reduce other long-term debt. Other changes resulting
from consolidation and currency effects led to an increase
of EUR 245 million.
Long-term debt as a proportion of the total debt stood at
85% at the end of 2009 with average remaining term of 9.6
years, compared to 83% at the end of 2008.
4.2.6 Net debt to group equity
Philips ended 2009 in a net cash position (cash and cash
equivalents, net of debt) of EUR 119 million, compared to
a net debt position of EUR 568 million at the end of 2008.
Net debt (cash) to group equity2)
in billions of euros ■-net debt (cash)--■-group equity1)
25
20
15
10
5
0
(5)
(10)
(0.6)
17.5
(4) : 104
2005
(2.0)
23.2
(9) : 109
2006
(5.2)
21.9
(31) : 131
2007
0.6
15.6
4 : 96
2008
(0.1)
14.6
(1) : 101
2009
ratio:
1) Stockholders’ equity and minority interests
2) For a reconciliation to the most directly comparable GAAP measures, see the
chapter Reconciliation of non-GAAP information
4.2.7 Stockholders’ equity
Stockholders’ equity declined by EUR 949 million in 2009
to EUR 14,595 million at December 31, 2009. The
decrease was mainly as a result of a EUR 404 million
reduction from total comprehensive income. The
dividend payment to shareholders in 2009 further
reduced equity by EUR 647 million. The decrease was
partially offset by a EUR 102 million increase related to
re-issuance of treasury stock and net share-based
compensation plans.
Stockholders’ equity declined by EUR 6,197 million in
2008 to EUR 15,544 million at December 31, 2008. The
decrease was mainly attributable to share repurchase
programs for capital reduction purposes, as well as the
hedging of long-term incentive and employee stock
4 Our group performance 4.2.4 - 4.2.7
70 Philips Annual Report 2009