Philips 2009 Annual Report Download - page 200
Download and view the complete annual report
Please find page 200 of the 2009 Philips annual report below. You can navigate through the pages in the report by either clicking on the pages listed below, or by using the keyword search tool below to find specific information within the annual report.-
 1
1 -
2
-
3
-
4
-
5
-
6
-
7
-
8
-
9
-
10
-
11
-
12
-
13
-
14
-
15
-
16
-
17
-
18
-
19
-
20
-
21
-
22
-
23
-
24
-
25
-
26
-
27
-
28
-
29
-
30
-
31
-
32
-
33
-
34
-
35
-
36
-
37
-
38
-
39
-
40
-
41
-
42
-
43
-
44
-
45
-
46
-
47
-
48
-
49
-
50
-
51
-
52
-
53
-
54
-
55
-
56
-
57
-
58
-
59
-
60
-
61
-
62
-
63
-
64
-
65
-
66
-
67
-
68
-
69
-
70
-
71
-
72
-
73
-
74
-
75
-
76
-
77
-
78
-
79
-
80
-
81
-
82
-
83
-
84
-
85
-
86
-
87
-
88
-
89
-
90
-
91
-
92
-
93
-
94
-
95
-
96
-
97
-
98
-
99
-
100
-
101
-
102
-
103
-
104
-
105
-
106
-
107
-
108
-
109
-
110
-
111
-
112
-
113
-
114
-
115
-
116
-
117
-
118
-
119
-
120
-
121
-
122
-
123
-
124
-
125
-
126
-
127
-
128
-
129
-
130
-
131
-
132
-
133
-
134
-
135
-
136
-
137
-
138
-
139
-
140
-
141
-
142
-
143
-
144
-
145
-
146
-
147
-
148
-
149
-
150
-
151
-
152
-
153
-
154
-
155
-
156
-
157
-
158
-
159
-
160
-
161
-
162
-
163
-
164
-
165
-
166
-
167
-
168
-
169
-
170
-
171
-
172
-
173
-
174
-
175
-
176
-
177
-
178
-
179
-
180
-
181
-
182
-
183
-
184
-
185
-
186
-
187
-
188
-
189
-
 190
190 -
 191
191 -
 192
192 -
 193
193 -
 194
194 -
 195
195 -
 196
196 -
 197
197 -
 198
198 -
 199
199 -
 200
200 -
 201
201 -
 202
202 -
 203
203 -
 204
204 -
 205
205 -
 206
206 -
 207
207 -
 208
208 -
 209
209 -
 210
210 -
211
-
212
-
213
-
214
-
215
-
216
-
217
-
218
-
219
-
220
-
221
-
222
-
223
-
224
-
225
-
226
-
227
-
228
-
229
-
230
-
231
-
232
-
233
-
234
-
235
-
236
-
237
-
238
-
239
-
240
-
241
-
242
-
243
-
244
 |
 |

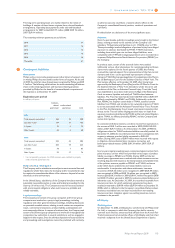
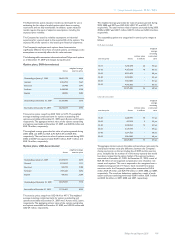
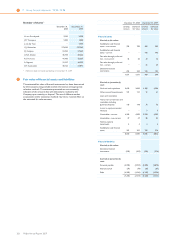
A summary of the status of the Company’s restricted share plans as of
December 31, 2009 and changes during the year are presented below:
Restricted share rights, EUR-denominated1)
shares
weighted
average grant-
date fair value
Outstanding at January 1, 2009 2,398,600 24.96
Granted 892,832 11.34
Vested/Issued 1,108,249 25.85
Forfeited 154,618 24.03
Outstanding at December 31, 2009 2,028,565 18.56
1) Excludes 20% additional (premium) shares that may be received if shares
delivered under the restricted share rights plan are not sold for a three-year
period.
Restricted share rights, USD-denominated
shares
weighted
average grant-
date fair value
Outstanding at January 1, 2009 1,983,504 35.09
Granted 652,146 15.36
Vested/Issued 872,596 35.35
Forfeited 161,053 33.75
Outstanding at December 31, 2009 1,602,001 27.06
1) Excludes 20% additional (premium) shares that may be received if shares
delivered under the restricted share rights plan are not sold for a three-year
period.
At December 31, 2009, a total of EUR 35 million of unrecognized
compensation cost related to non-vested restricted share rights. This
cost is expected to be recognized over a weighted-average period of 2.0
years.
In December 2006, the Company offered to exchange outstanding
Lumileds Depository Receipts and options for cash and shared-based
instruments settled in cash. The amount to be paid to settle the
obligation, with respect to share-based instruments, will fluctuate based
upon changes in the fair value of Lumileds. Substantially all of the holders
of the options and the depository receipts accepted the Company offer.
The amount of the share-based payment liability, which is denominated
in US dollars, recorded at December 31, 2008 was EUR 10.4 million.
During 2009, the Company paid EUR 5.9 million as a part of the
settlement of the liability. Additionally, an increase of EUR 27.1 million
was recognized to reflect an adjustment to the value of the liability. The
balance at December 31, 2009 amounted to EUR 31.6 million which will
be settled between 2010 and 2012.
31 Information on remuneration
Remuneration of the Board of Management
In 2009, remuneration and pension charges relating to the members of
the Board of Management amounted to EUR 5,970,230 (2008:
EUR 6,992,350, 2007: EUR 8,732,378). In 2009, an amount of EUR
621,147 (2008: EUR 619,252, 2007: EUR 739,861) was awarded in the
form of other compensation. When pension rights are granted to
members of the Board of Management, necessary payments (if insured)
and all necessary provisions are made in accordance with the applicable
accounting principles. In 2009, no (additional) pension benefits were
granted to former members of the Board of Management.
In 2009, the members of the Board of Management were granted
259,200 stock options (2008: 259,218 stock options, 2007: 318,132
stock options) and 69,132 restricted share rights (2008: 86,406
restricted share rights; 2007: 106,044 restricted share rights).
At December 31, 2009, the members of the Board of Management held
2,064,872 stock options (2008: 1,805,672; 2007: 1,771,097) at a
weighted average exercise price of EUR 25.47 (2008: EUR 27.31; 2007:
EUR 28.05).
Please refer to section 9.3, Report of the Remuneration Committee, of
this Annual Report for further information.
31 11 Group financial statements 11.12 - 11.12
200 Philips Annual Report 2009