Philips 2009 Annual Report Download - page 213
Download and view the complete annual report
Please find page 213 of the 2009 Philips annual report below. You can navigate through the pages in the report by either clicking on the pages listed below, or by using the keyword search tool below to find specific information within the annual report.-
 1
1 -
2
-
3
-
4
-
5
-
6
-
7
-
8
-
9
-
10
-
11
-
12
-
13
-
14
-
15
-
16
-
17
-
18
-
19
-
20
-
21
-
22
-
23
-
24
-
25
-
26
-
27
-
28
-
29
-
30
-
31
-
32
-
33
-
34
-
35
-
36
-
37
-
38
-
39
-
40
-
41
-
42
-
43
-
44
-
45
-
46
-
47
-
48
-
49
-
50
-
51
-
52
-
53
-
54
-
55
-
56
-
57
-
58
-
59
-
60
-
61
-
62
-
63
-
64
-
65
-
66
-
67
-
68
-
69
-
70
-
71
-
72
-
73
-
74
-
75
-
76
-
77
-
78
-
79
-
80
-
81
-
82
-
83
-
84
-
85
-
86
-
87
-
88
-
89
-
90
-
91
-
92
-
93
-
94
-
95
-
96
-
97
-
98
-
99
-
100
-
101
-
102
-
103
-
104
-
105
-
106
-
107
-
108
-
109
-
110
-
111
-
112
-
113
-
114
-
115
-
116
-
117
-
118
-
119
-
120
-
121
-
122
-
123
-
124
-
125
-
126
-
127
-
128
-
129
-
130
-
131
-
132
-
133
-
134
-
135
-
136
-
137
-
138
-
139
-
140
-
141
-
142
-
143
-
144
-
145
-
146
-
147
-
148
-
149
-
150
-
151
-
152
-
153
-
154
-
155
-
156
-
157
-
158
-
159
-
160
-
161
-
162
-
163
-
164
-
165
-
166
-
167
-
168
-
169
-
170
-
171
-
172
-
173
-
174
-
175
-
176
-
177
-
178
-
179
-
180
-
181
-
182
-
183
-
184
-
185
-
186
-
187
-
188
-
189
-
190
-
191
-
192
-
193
-
194
-
195
-
196
-
197
-
198
-
199
-
200
-
201
-
202
-
 203
203 -
 204
204 -
 205
205 -
 206
206 -
 207
207 -
 208
208 -
 209
209 -
 210
210 -
 211
211 -
 212
212 -
 213
213 -
 214
214 -
 215
215 -
 216
216 -
 217
217 -
 218
218 -
 219
219 -
 220
220 -
 221
221 -
 222
222 -
 223
223 -
224
-
225
-
226
-
227
-
228
-
229
-
230
-
231
-
232
-
233
-
234
-
235
-
236
-
237
-
238
-
239
-
240
-
241
-
242
-
243
-
244
 |
 |

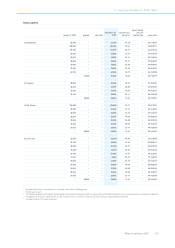
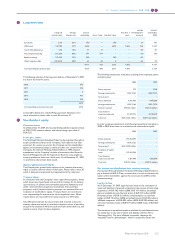
FLong-term debt
(range of)
interest rates
average
interest rate
amount
outstanding due in 1 year due after 1 year
due after 5
years
average
remaining term
(in years)
amount
outstanding
2008
Eurobonds 6.1% 6.1% 750 − 750 − 1.4 750
USD bonds 1.4-7.8% 5.7% 2,494 − 2,494 1,803 13.0 2,547
Convertible debentures 1.5% 1.5% 51 51 − − 0.0 81
Intercompany financing 0.1-3.4% 0.9% 571 571 − − 0.0 718
Bank borrowings 2.7-4.2% 2.7% 250 − 250 − 4.1 −
Other long-term debt 4.5-18.1% 5.8% 61 53 8 − 2.5 59
4,177 675 3,502 1,803 4,155
Corresponding data previous year 4,155 844 3,311 1,841 5,124
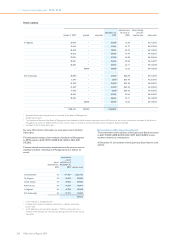
The following amounts of the long-term debt as of December 31, 2009,
are due in the next five years:
2010 675
2011 995
2012 3
2013 451
2014 250
2,374
Corresponding amount previous year 2,314
Convertible debentures include Philips personnel debentures. For
more information, please refer to note 20 and note 21.
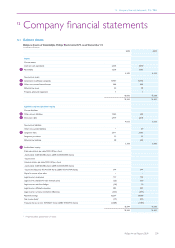
GStockholders’ equity
Common shares
As of December 31, 2009, the issued and fully paid share capital consists
of 972,411,769 common shares, each share having a par value of
EUR 0.20.
Preference shares
The ‘Stichting Preferente Aandelen Philips’ has been granted the right to
acquire preference shares in the Company. Such right has not been
exercised. As a means to protect the Company and its stakeholders
against an unsolicited attempt to (de facto) take over control of the
Company, the General Meeting of Shareholders in 1989 adopted
amendments to the Company’s articles of association that allow the
Board of Management and the Supervisory Board to issue (rights to
acquire) preference shares to a third party. As of December 31, 2009,
no preference shares have been issued.
Option rights/restricted shares
The Company has granted stock options on its common shares and
rights to receive common shares in the future. Please refer to note 30,
which is deemed incorporated and repeated herein by reference.
Treasury shares
In connection with the Company’s share repurchase programs, shares
which have been repurchased and are held in treasury for (i) delivery
upon exercise of options and convertible personnel debentures and
under restricted share programs and employee share purchase
programs, and (ii) capital reduction purposes, are accounted for as a
reduction of stockholders’ equity. Treasury shares are recorded at
cost, representing the market price on the acquisition date. When
issued, shares are removed from treasury stock on a FIFO basis.
Any difference between the cost and the cash received at the time
treasury shares are issued, is recorded in capital in excess of par value,
except in the situation in which the cash received is lower than cost, and
capital in excess of par has been depleted.
The following transactions took place resulting from employee option
and share plans:
2008 2009
Shares acquired 273 2,128
Average market price EUR 24.61 EUR 19.10
Amount paid − −
Shares delivered 4,541,969 4,477,364
Average market price EUR 23.44 EUR 13.76
Amount received EUR 52 million EUR 32 million
Total shares in
treasury at year-end 47,577,915 43,102,679
Total cost EUR 1,263 million EUR 1,162 million
In order to reduce capital stock, the following transactions took place in
2008, in 2009 there were no transactions to reduce share capital:
2008 2009
Shares acquired 146,453,094 −
Average market price EUR 22.52 −
Amount paid EUR 3,298 million −
Reduction of capital
stock 170,414,994 −
Total shares in
treasury at year-end 1,851,998 1,851,998
Total cost EUR 25 million EUR 25 million
Net income and distribution from retained earnings
A proposal will be submitted to the General Meeting of Shareholders to
pay a dividend of EUR 0.70 per common share, in cash or shares at the
option of the shareholder, against the net income for 2009 and the
retained earnings.
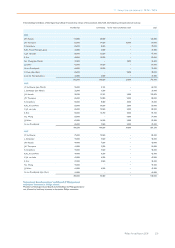
Legal reserves
As of December 31, 2009, legal reserves relate to the revaluation of
assets and liabilities of acquired companies in the context of multi-stage
acquisitions of EUR 102 million (2008: EUR 117 million), unrealized
gains on available-for-sale financial assets of EUR 120 million (2008:
unrealized losses of EUR 25 million), unrealized gains on cash flow
hedges of EUR 10 million (2008: unrealized losses of EUR 28 million),
‘affiliated companies’ of EUR 829 million (2008: EUR 985 million) and
currency translation losses of EUR 591 million (2008: losses of EUR 527
million).
The movement in unrealized results on available-for-sale financial assets
are mainly due to the sale of shares (LG Display and Pace Micro
Technology Plc.). The item ‘affiliated companies’ relates to the
‘wettelijke reserve deelnemingen’, which is required by Dutch law.
12 Company financial statements 12.5 - 12.5 F G
Philips Annual Report 2009 213