Philips 2009 Annual Report Download - page 4
Download and view the complete annual report
Please find page 4 of the 2009 Philips annual report below. You can navigate through the pages in the report by either clicking on the pages listed below, or by using the keyword search tool below to find specific information within the annual report.-
 1
1 -
 2
2 -
 3
3 -
 4
4 -
 5
5 -
 6
6 -
 7
7 -
 8
8 -
 9
9 -
 10
10 -
 11
11 -
 12
12 -
 13
13 -
 14
14 -
 15
15 -
16
-
17
-
18
-
19
-
20
-
21
-
22
-
23
-
24
-
25
-
26
-
27
-
28
-
29
-
30
-
31
-
32
-
33
-
34
-
35
-
36
-
37
-
38
-
39
-
40
-
41
-
42
-
43
-
44
-
45
-
46
-
47
-
48
-
49
-
50
-
51
-
52
-
53
-
54
-
55
-
56
-
57
-
58
-
59
-
60
-
61
-
62
-
63
-
64
-
65
-
66
-
67
-
68
-
69
-
70
-
71
-
72
-
73
-
74
-
75
-
76
-
77
-
78
-
79
-
80
-
81
-
82
-
83
-
84
-
85
-
86
-
87
-
88
-
89
-
90
-
91
-
92
-
93
-
94
-
95
-
96
-
97
-
98
-
99
-
100
-
101
-
102
-
103
-
104
-
105
-
106
-
107
-
108
-
109
-
110
-
111
-
112
-
113
-
114
-
115
-
116
-
117
-
118
-
119
-
120
-
121
-
122
-
123
-
124
-
125
-
126
-
127
-
128
-
129
-
130
-
131
-
132
-
133
-
134
-
135
-
136
-
137
-
138
-
139
-
140
-
141
-
142
-
143
-
144
-
145
-
146
-
147
-
148
-
149
-
150
-
151
-
152
-
153
-
154
-
155
-
156
-
157
-
158
-
159
-
160
-
161
-
162
-
163
-
164
-
165
-
166
-
167
-
168
-
169
-
170
-
171
-
172
-
173
-
174
-
175
-
176
-
177
-
178
-
179
-
180
-
181
-
182
-
183
-
184
-
185
-
186
-
187
-
188
-
189
-
190
-
191
-
192
-
193
-
194
-
195
-
196
-
197
-
198
-
199
-
200
-
201
-
202
-
203
-
204
-
205
-
206
-
207
-
208
-
209
-
210
-
211
-
212
-
213
-
214
-
215
-
216
-
217
-
218
-
219
-
220
-
221
-
222
-
223
-
224
-
225
-
226
-
227
-
228
-
229
-
230
-
231
-
232
-
233
-
234
-
235
-
236
-
237
-
238
-
239
-
240
-
241
-
242
-
243
-
244
 |
 |

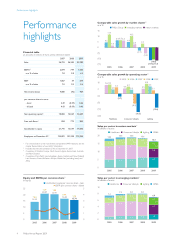
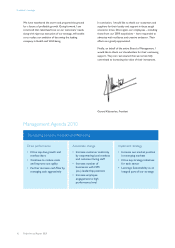
Performance
highlights
Financial table
all amounts in millions of euros unless otherwise stated
2007 2008 2009
Sales 26,793 26,385 23,189
EBITA1) 2,094 744 1,050
as a % of sales 7.8 2.8 4.5
EBIT 1,867 54 614
as a % of sales 7.0 0.2 2.6
Net income (loss) 4,880 (92) 424
per common share in euros
- basic 4.49 (0.09) 0.46
- diluted 4.43 (0.09) 0.46
Net operating capital1) 10,802 14,069 12,649
Free cash flows1) 824 773 863
Stockholders’ equity 21,741 15,544 14,595
Employees at December 312) 123,801 121,398 115,924
1) For a reconciliation to the most directly comparable GAAP measures, see the
chapter Reconciliation of non-GAAP information
2) Includes discontinued operations 5,703 at December 31, 2007
3) Comprises of Western Europe, North America, Japan, Korea, Israel, Australia
and New Zealand
4) Comprises of Asia Pacific (excluding Japan, Korea, Australia and New Zealand)
Latin America, Central & Eastern Europe, Middle East (excluding Israel) and
Africa
Equity and EBITA per common share1)
in euros ■-stockholders’ equity per common share - basic
--EBITA per common share - diluted
25
20
15
10
5
0
5
4
3
2
1
0
1.52
14.25
2005
1.29
20.87
2006
1.91
20.41
2007
0.75
16.84
2008
1.13
15.74
2009
Comparable sales growth by market cluster1)
as a % ■-Philips Group--■-emerging markets--■-mature markets
15
10
5
0
(5)
(10)
(15)
4.5
11.7
1.8
2005
6.4 6.5 6.3
2006
4.9
10.2
2.8
2007
(2.7)
3.5
(5.4)
2008
(11.4)
(10.8)
(11.7)
2009
Comparable sales growth by operating sector1)
as a % ■-2005--■-2006--■-2007--■-2008--■-2009
10
4
(2)
(8)
(14)
(20)
7.8 8.2
3.7
5.6
(2.7)
Healthcare
4.7 6.3
3.5
(8.9)
(16.5)
Consumer Lifestyle
4.5
8.8
6.5
3.1
(12.6)
Lighting
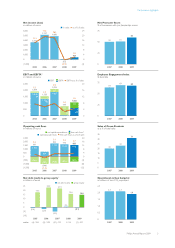
Sales per sector in mature markets3)
in billions of euros
■-Healthcare--■-Consumer Lifestyle--■-Lighting--■-GM&S
20
15
10
5
0
2005
5.1
8.2
3.31.4
18.0
2006
5.5
8.5
3.71.1
18.8
2007
5.5
8.7
4.1
0.5
18.8
2008
6.4
6.7
5.0
0.3
18.4
2009
6.4
5.4
4.3
0.2
16.3
Sales per sector in emerging markets4)
in billions of euros
■-Healthcare--■-Consumer Lifestyle --■-Lighting--■-GM&S
10
8
6
4
2
0
2005
0.9
4.3
1.60.6
7.4
2006
1.1
4.4
2.0
0.4
7.9
2007
1.1
4.5
2.2
0.2
8.0
2008
1.2
4.2
2.4
0.2
8.0
2009
1.5
3.1
2.2
0.1
6.9
Performance highlights
4 Philips Annual Report 2009