Philips 2009 Annual Report Download - page 117
Download and view the complete annual report
Please find page 117 of the 2009 Philips annual report below. You can navigate through the pages in the report by either clicking on the pages listed below, or by using the keyword search tool below to find specific information within the annual report.-
 1
1 -
2
-
3
-
4
-
5
-
6
-
7
-
8
-
9
-
10
-
11
-
12
-
13
-
14
-
15
-
16
-
17
-
18
-
19
-
20
-
21
-
22
-
23
-
24
-
25
-
26
-
27
-
28
-
29
-
30
-
31
-
32
-
33
-
34
-
35
-
36
-
37
-
38
-
39
-
40
-
41
-
42
-
43
-
44
-
45
-
46
-
47
-
48
-
49
-
50
-
51
-
52
-
53
-
54
-
55
-
56
-
57
-
58
-
59
-
60
-
61
-
62
-
63
-
64
-
65
-
66
-
67
-
68
-
69
-
70
-
71
-
72
-
73
-
74
-
75
-
76
-
77
-
78
-
79
-
80
-
81
-
82
-
83
-
84
-
85
-
86
-
87
-
88
-
89
-
90
-
91
-
92
-
93
-
94
-
95
-
96
-
97
-
98
-
99
-
100
-
101
-
102
-
103
-
104
-
105
-
106
-
 107
107 -
 108
108 -
 109
109 -
 110
110 -
 111
111 -
 112
112 -
 113
113 -
 114
114 -
 115
115 -
 116
116 -
 117
117 -
 118
118 -
 119
119 -
 120
120 -
 121
121 -
 122
122 -
 123
123 -
 124
124 -
 125
125 -
 126
126 -
 127
127 -
128
-
129
-
130
-
131
-
132
-
133
-
134
-
135
-
136
-
137
-
138
-
139
-
140
-
141
-
142
-
143
-
144
-
145
-
146
-
147
-
148
-
149
-
150
-
151
-
152
-
153
-
154
-
155
-
156
-
157
-
158
-
159
-
160
-
161
-
162
-
163
-
164
-
165
-
166
-
167
-
168
-
169
-
170
-
171
-
172
-
173
-
174
-
175
-
176
-
177
-
178
-
179
-
180
-
181
-
182
-
183
-
184
-
185
-
186
-
187
-
188
-
189
-
190
-
191
-
192
-
193
-
194
-
195
-
196
-
197
-
198
-
199
-
200
-
201
-
202
-
203
-
204
-
205
-
206
-
207
-
208
-
209
-
210
-
211
-
212
-
213
-
214
-
215
-
216
-
217
-
218
-
219
-
220
-
221
-
222
-
223
-
224
-
225
-
226
-
227
-
228
-
229
-
230
-
231
-
232
-
233
-
234
-
235
-
236
-
237
-
238
-
239
-
240
-
241
-
242
-
243
-
244
 |
 |

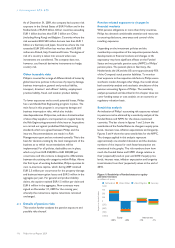
Figure 2: Sensitivity of funded status to inflation and
longevity
in millions of euros
Impact on funded status
■-Netherlands--■-United States--■-United Kingdom--■-Germany
750
500
250
0
(250)
(500)
(750) Inflation expectation
+1% -1%
Longevity trend
x2 x0
Figure 3: Sensitivity of NPPC to equity and interest
rates
in millions of euros
Impact on NPPC
■-Netherlands--■-United States--■-United Kingdom--■-Germany
150
100
50
0
(50)
(100)
(150) Equity
+20% -20%
Interest rate
+1% -1%
Figure 4: Sensitivity of NPPC to inflation and
longevity
in millions of euros
Impact on NPPC
■-Netherlands--■-United States--■-United Kingdom--■-Germany
50
25
0
(25)
(50) Inflation expectation
+1% -1%
Longevity trend
x2 x0
The sensitivity to changes in equity valuations is largest in
the Dutch plan, even though in relative terms there is a
larger percentage of equity exposure in the US. The size of
the overall sensitivity to longevity is comparable to the
sensitivity to equity prices. The plan in the Netherlands
contributes most, which is due to its relative size. The
aggregate Funded Status is less sensitive to interest rates.
This reflects the impact of Liability Driven Investment
(LDI) strategies in most countries. The interest rate
sensitivity for the Dutch plan is opposite to the sensitivity
in the other plans, because the LDI strategy adopted by
the plan matches the higher value of the pension liabilities
on a local valuation basis and not the lower value of the
accounting liabilities as reported by the Company.
Although an LDI strategy has been implemented in the US,
this plan shows the highest sensitivity to interest rates.
The aggregate Funded Status is least sensitive to changes
in the inflation assumption. This is due to the fact that the
Company has set its assumption for inflation for the
Netherlands and Germany at the long-term target of the
European Central Bank.
The aggregate NPPC is particularly sensitive to changes in
interest rates for the NPPC in the Netherlands. NPPC is
to a lesser extent sensitive to changes in equity valuations
and longevity. Due to the absolute size of the exposure to
equities, the highest sensitivity to equities still exists in the
Netherlands. The highest sensitivity to longevity also
exists in the Netherlands. The aggregate NPPC is least
sensitive to changes in inflation assumption due to the
selection of the inflation assumption for the Netherlands
as referred to in the previous paragraph.
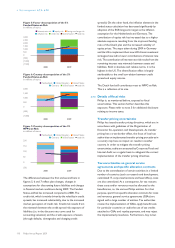
Stochastic analysis
The sensitivities described above reflect the impacts of
separate changes in equity prices, interest rates, etc. As
such changes are historically unlikely to happen
simultaneously, a simple summation of the above-
mentioned sensitivities would overestimate the total risk
exposure. The difference between the total risk and the
summation represents the so-called diversification effect.
It results from the less than perfect (or even negative)
correlation between the respective risk factors. The
diversification effect may be captured by a stochastic
analysis, i.e. by analyzing the outcomes of a large number
of simulations.
These simulations are based on the volatility of and
correlations between the respective risk factors over the
past 30 years. The bar charts below show the maximum
deviations from the expected aggregate Funded Status at
year-end 2009 and year-end 2010 and the expected NPPC
for 2010 and 2011, if the 5% worst possible outcomes are
excluded. These ‘Funded-Status-at-risk’ and ‘NPPC-at-
Risk’ measures are based on the valuations of plan assets
and liabilities on December 31, 2008 and December 31,
2009, respectively, and may therefore be seen as
indicators of the accounting risks on these same dates.
Figure 5 shows both the contribution of the separate risk
factors and the diversification effect. Contrary to figures 1
and 2, it excludes the impact of longevity risk, but it
includes the impact of credit risk and foreign exchange
risk. Figures 6 and 7 show both the contributions of the
risk exposures in the four biggest pension countries and
the diversification between them.
6 Risk management 6.7.3 - 6.7.3
Philips Annual Report 2009 117