Philips 2009 Annual Report Download - page 218
Download and view the complete annual report
Please find page 218 of the 2009 Philips annual report below. You can navigate through the pages in the report by either clicking on the pages listed below, or by using the keyword search tool below to find specific information within the annual report.-
 1
1 -
2
-
3
-
4
-
5
-
6
-
7
-
8
-
9
-
10
-
11
-
12
-
13
-
14
-
15
-
16
-
17
-
18
-
19
-
20
-
21
-
22
-
23
-
24
-
25
-
26
-
27
-
28
-
29
-
30
-
31
-
32
-
33
-
34
-
35
-
36
-
37
-
38
-
39
-
40
-
41
-
42
-
43
-
44
-
45
-
46
-
47
-
48
-
49
-
50
-
51
-
52
-
53
-
54
-
55
-
56
-
57
-
58
-
59
-
60
-
61
-
62
-
63
-
64
-
65
-
66
-
67
-
68
-
69
-
70
-
71
-
72
-
73
-
74
-
75
-
76
-
77
-
78
-
79
-
80
-
81
-
82
-
83
-
84
-
85
-
86
-
87
-
88
-
89
-
90
-
91
-
92
-
93
-
94
-
95
-
96
-
97
-
98
-
99
-
100
-
101
-
102
-
103
-
104
-
105
-
106
-
107
-
108
-
109
-
110
-
111
-
112
-
113
-
114
-
115
-
116
-
117
-
118
-
119
-
120
-
121
-
122
-
123
-
124
-
125
-
126
-
127
-
128
-
129
-
130
-
131
-
132
-
133
-
134
-
135
-
136
-
137
-
138
-
139
-
140
-
141
-
142
-
143
-
144
-
145
-
146
-
147
-
148
-
149
-
150
-
151
-
152
-
153
-
154
-
155
-
156
-
157
-
158
-
159
-
160
-
161
-
162
-
163
-
164
-
165
-
166
-
167
-
168
-
169
-
170
-
171
-
172
-
173
-
174
-
175
-
176
-
177
-
178
-
179
-
180
-
181
-
182
-
183
-
184
-
185
-
186
-
187
-
188
-
189
-
190
-
191
-
192
-
193
-
194
-
195
-
196
-
197
-
198
-
199
-
200
-
201
-
202
-
203
-
204
-
205
-
206
-
207
-
 208
208 -
 209
209 -
 210
210 -
 211
211 -
 212
212 -
 213
213 -
 214
214 -
 215
215 -
 216
216 -
 217
217 -
 218
218 -
 219
219 -
 220
220 -
 221
221 -
 222
222 -
 223
223 -
 224
224 -
 225
225 -
 226
226 -
 227
227 -
 228
228 -
229
-
230
-
231
-
232
-
233
-
234
-
235
-
236
-
237
-
238
-
239
-
240
-
241
-
242
-
243
-
244
 |
 |

• Based on the Maplecroft Human Rights Risk Indexes, risk countries
for Supply Management in 2009 were: Belarus, Brazil, China, India,
Indonesia, Mexico, Pakistan, Philippines, Russia, Thailand, Ukraine
and Vietnam.
• Suppliers of new ventures are included to the extent that the
integration process of these ventures has been finalized. Normative
integration period is two years after closure of the new venture.
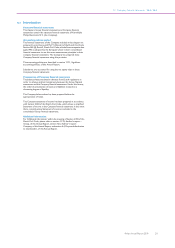
External assurance
KPMG has provided limited assurance on whether the information in
this section Sustainability performance is fairly stated. We refer to
KPMG’s section 13.6, Independent assurance report, of this Annual
Report.
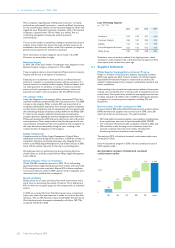
13.2 Economic indicators
This section provides summarized information on contributions on an
accruals basis to the most important economic stakeholders as a basis
to drive economic growth. For a full understanding of each of these
indicators, please refer to the financial statements and notes in this
report.
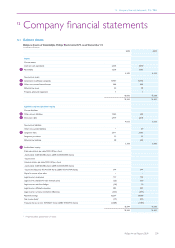
Distribution of direct economic benefits
in millions of euros
2009
Suppliers: goods and services 15,110
Employees: salaries and wages 5,075
Shareholders: distribution from retained earnings 647
Government: corporate income taxes 100
Capital providers: net interest 252
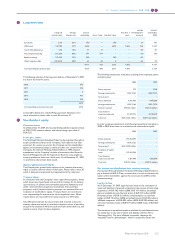
The total amount of purchased goods and services was EUR 15.1 billion,
representing 65% of total revenues of the Philips Group. Of this amount
63% was spent with global suppliers, the remainder with local suppliers.
Compared with 2008, spending both in absolute terms and as a
percentage of sales decreased, reflecting lower sales and strict cost
management.
in millions of euros
2007 2008 2009
Total supply spend 17,603 17,918 15,110
In 2009 the salaries and wages totaled EUR 5.1 billion. This amount is
comparable to 2008 and contains restructuring charges. Please refer to
note 3 for more information.
in millions of euros
2007 2008 2009
Total salaries and wages 4,607 5,094 5,075
Distribution from retained earnings to shareholders amounted to
EUR 647 million. This reflects the reduced number of outstanding
shares.
in millions of euros
2007 2008 20091)
Dividend distributed 659 720 647
1) Distribution from retained earnings
Corporate income taxes decreased significantly in 2009 to EUR 100
million, mainly attributable to a net tax benefit related to the
recognition of a deferred tax asset for Lumileds and the net effect of
lower incidental charges. For a further understanding, please refer to
note 5.
in millions of euros
2007 2008 2009
Corporate income taxes 582 256 100
13.3 Environmental indicators
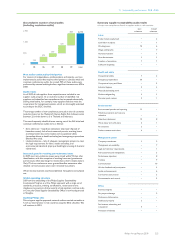
EcoVision4: Green Product sales
Sales from Green Products increased in 2009 to EUR 7.1 billion,
contributing significantly to the total revenue stream. As a percentage
of the company total sales, Green Product sales rose substantially to
30.6%, up from 22.6% in 2008, exceeding our EcoVision4 target for
2012. As a result we have increased our target to 50% in 2015.
Green Product sales
in billions of euros unless otherwise stated
2007 2008 2009
Philips Group 5.3 6.0 7.1
as a % of total sales 19.8 22.6 30.6
All sectors contributed to the growth in Green Product sales.
Consumer Lifestyle achieved the highest Green Product nominal sales
growth (30%), followed by Healthcare (17%) and Lighting (14%).
Consumer Lifestyle introduced 81 Green Products in 2009, Healthcare
15 and Lighting over 700. Major acquisitions, like Respironics,
Consumer Luminaires and Genlyte, have been included for the first
time, causing the decrease in Green Product sales in 2008 in Healthcare
and Lighting. Prior to joining Philips these acquisitions did not have a
process in place to develop new products with significantly improved
environmental performance and it takes time to bring new products
through the pipeline.
Green Product sales per sector
as a % of total sales
2007 2008 2009
Healthcare 22 20 23
Consumer Lifestyle 8 14 23
Lighting 46 40 52
Philips Group 20 23 31
Overall, improvements are predominantly realized in our energy
efficiency Green Focal Area.
New Green Products from each sector include the following examples.
Healthcare
The new MammoDiagnost DR simplifies the image acquisition. The
workflow is fast, easy to handle and intuitive. The digital image
processing supports the detection of lesions especially in dense breasts.
Time consuming handling of film cassettes is no longer required. The
digital system follows the Digital Imaging and Communications in
Medicine (DICOM) and Integrating the Healthcare Enterprise (IHE)
standards and can be integrated into the electronic workflow of the
hospital. That means that patient registration and diagnosis can be done
without paper work.
Compared to its predecessor, this Green Product’s environmental
benefits include a 46% reduction in energy use, 13% less product weight,
11% less packaging weight and an improvement of the environmental
impact of the total life cycle of 24%. In addition the X-ray dose is
reduced by 20%.
Consumer Lifestyle
The Philips EcoDesign process aims to create products that have
significantly less impact on the environment. Our Consumer Lifestyle
sector has long focused on energy management, for example, drastically
driving down standby power in TVs over the past 10 years. We are
proud that 90% of our TV portfolio has been awarded the EU Ecolabel
after verification that the products meet the EU’s high environmental
and performance standards. The televisions carry the label’s flower
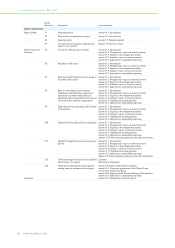
13 Sustainability performance 13.1 - 13.3
218 Philips Annual Report 2009