Philips 2009 Annual Report Download - page 118
Download and view the complete annual report
Please find page 118 of the 2009 Philips annual report below. You can navigate through the pages in the report by either clicking on the pages listed below, or by using the keyword search tool below to find specific information within the annual report.-
 1
1 -
2
-
3
-
4
-
5
-
6
-
7
-
8
-
9
-
10
-
11
-
12
-
13
-
14
-
15
-
16
-
17
-
18
-
19
-
20
-
21
-
22
-
23
-
24
-
25
-
26
-
27
-
28
-
29
-
30
-
31
-
32
-
33
-
34
-
35
-
36
-
37
-
38
-
39
-
40
-
41
-
42
-
43
-
44
-
45
-
46
-
47
-
48
-
49
-
50
-
51
-
52
-
53
-
54
-
55
-
56
-
57
-
58
-
59
-
60
-
61
-
62
-
63
-
64
-
65
-
66
-
67
-
68
-
69
-
70
-
71
-
72
-
73
-
74
-
75
-
76
-
77
-
78
-
79
-
80
-
81
-
82
-
83
-
84
-
85
-
86
-
87
-
88
-
89
-
90
-
91
-
92
-
93
-
94
-
95
-
96
-
97
-
98
-
99
-
100
-
101
-
102
-
103
-
104
-
105
-
106
-
107
-
 108
108 -
 109
109 -
 110
110 -
 111
111 -
 112
112 -
 113
113 -
 114
114 -
 115
115 -
 116
116 -
 117
117 -
 118
118 -
 119
119 -
 120
120 -
 121
121 -
 122
122 -
 123
123 -
 124
124 -
 125
125 -
 126
126 -
 127
127 -
 128
128 -
129
-
130
-
131
-
132
-
133
-
134
-
135
-
136
-
137
-
138
-
139
-
140
-
141
-
142
-
143
-
144
-
145
-
146
-
147
-
148
-
149
-
150
-
151
-
152
-
153
-
154
-
155
-
156
-
157
-
158
-
159
-
160
-
161
-
162
-
163
-
164
-
165
-
166
-
167
-
168
-
169
-
170
-
171
-
172
-
173
-
174
-
175
-
176
-
177
-
178
-
179
-
180
-
181
-
182
-
183
-
184
-
185
-
186
-
187
-
188
-
189
-
190
-
191
-
192
-
193
-
194
-
195
-
196
-
197
-
198
-
199
-
200
-
201
-
202
-
203
-
204
-
205
-
206
-
207
-
208
-
209
-
210
-
211
-
212
-
213
-
214
-
215
-
216
-
217
-
218
-
219
-
220
-
221
-
222
-
223
-
224
-
225
-
226
-
227
-
228
-
229
-
230
-
231
-
232
-
233
-
234
-
235
-
236
-
237
-
238
-
239
-
240
-
241
-
242
-
243
-
244
 |
 |

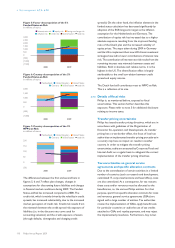
Figure 5: Factor decomposition of the 5%
Funded-Status-at-Risk
in millions of euros
■-interest rate risk--■-equity risk--■-foreign exchange risk
■-inflation risk--■-credit risk--■-diversification----total risk
3,000
2,500
2,000
1,500
1,000
500
0
(500)
(1,000)
(1,500)
2008 2009
Figure 6: Country decomposition of the 5%
Funded-Status-at-Risk
in millions of euros
■-Netherlands--■-United Kingdom--■-United States
■-Germany--■-diversification----total risk
2,000
1,500
1,000
500
0
(500)
(1,000)
2008 2009
Figure 7: Country decomposition of the 5%
NPPC-at-Risk
in millions of euros
■-Netherlands--■-United Kingdom--■-United States
■-Germany--■-diversification----total risk
200
150
100
50
0
(50)
2008 2009
The differences between the first and second bars in
figures 5, 6 and 7 reflect plan changes, changes in
assumptions for discounting future liabilities and changes
in financial market conditions during 2009. The Funded-
Status-at-Risk has increased compared to 2008. The
credit risk, which is mainly driven by the volatility in credit
spreads, has increased substantially, due to the increased
market perception of credit risk. Credit risk results from
the mismatch between the credit spread risk exposure of
liabilities (i.e. in the discount rate curve used for
accounting valuation) and the credit exposure of assets
(through defaults, downgrades and changing credit
spreads). On the other hand, the inflation element in the
funded status calculation has decreased significantly by
adoption of the ECB long-term target as the inflation
assumption for the Netherlands and Germany. The
contribution of equity risk has increased due to a higher
absolute exposure resulting from the improved funding
ratio of the Dutch plan and the increased volatility of
equity prices. The steps taken during 2009 in Germany
and the US to implement their new LDI driven investment
strategies have led to lower contributions of interest rate
risk. The contribution of interest rate risk results from the
remaining interest rate mismatch between assets and
liabilities. Both in absolute and relative terms, it is the
highest in the US. The diversification effect is largely
attributable to the small correlation between credit
spread and equity returns.
The Dutch fund still contributes most to NPPC-at-Risk.
This is a reflection of its size.
6.7.4 Details of fiscal risks
Philips is, as mentioned before, exposed to fiscal
uncertainties. This section further describes this
exposure. Please refer to note 5 for additional disclosure
relating to income taxes.
Transfer pricing uncertainties
Philips has issued transfer pricing directives, which are in
accordance with guidelines of the Organization of
Economic Co-operation and Development. As transfer
pricing has a cross-border effect, the focus of local tax
authorities on implemented transfer pricing procedures in
a country may have an impact on results in another
country. In order to mitigate the transfer pricing
uncertainties, audits are executed by Corporate Fiscal and
Internal Audit on a regular basis to safeguard the correct
implementation of the transfer pricing directives.
Tax uncertainties on general service
agreements and specific allocation contracts
Due to the centralization of certain activities in a limited
number of countries (such as research and development,
centralized IT, corporate functions and head office), costs
are also centralized. As a consequence, for tax reasons
these costs and/or revenues must be allocated to the
beneficiaries, i.e. the various Philips entities. For that
purpose, apart from specific allocation contracts for costs
and revenues, general service agreements (GSAs) are
signed with a large number of entities. Tax authorities
review the implementation of GSAs, apply benefit tests
for particular countries or audit the use of tax credits
attached to GSAs and royalty payments, and may reject
the implemented procedures. Furthermore, buy in/out
6 Risk management 6.7.3 - 6.7.4
118 Philips Annual Report 2009