Philips 2009 Annual Report Download - page 191
Download and view the complete annual report
Please find page 191 of the 2009 Philips annual report below. You can navigate through the pages in the report by either clicking on the pages listed below, or by using the keyword search tool below to find specific information within the annual report.-
 1
1 -
2
-
3
-
4
-
5
-
6
-
7
-
8
-
9
-
10
-
11
-
12
-
13
-
14
-
15
-
16
-
17
-
18
-
19
-
20
-
21
-
22
-
23
-
24
-
25
-
26
-
27
-
28
-
29
-
30
-
31
-
32
-
33
-
34
-
35
-
36
-
37
-
38
-
39
-
40
-
41
-
42
-
43
-
44
-
45
-
46
-
47
-
48
-
49
-
50
-
51
-
52
-
53
-
54
-
55
-
56
-
57
-
58
-
59
-
60
-
61
-
62
-
63
-
64
-
65
-
66
-
67
-
68
-
69
-
70
-
71
-
72
-
73
-
74
-
75
-
76
-
77
-
78
-
79
-
80
-
81
-
82
-
83
-
84
-
85
-
86
-
87
-
88
-
89
-
90
-
91
-
92
-
93
-
94
-
95
-
96
-
97
-
98
-
99
-
100
-
101
-
102
-
103
-
104
-
105
-
106
-
107
-
108
-
109
-
110
-
111
-
112
-
113
-
114
-
115
-
116
-
117
-
118
-
119
-
120
-
121
-
122
-
123
-
124
-
125
-
126
-
127
-
128
-
129
-
130
-
131
-
132
-
133
-
134
-
135
-
136
-
137
-
138
-
139
-
140
-
141
-
142
-
143
-
144
-
145
-
146
-
147
-
148
-
149
-
150
-
151
-
152
-
153
-
154
-
155
-
156
-
157
-
158
-
159
-
160
-
161
-
162
-
163
-
164
-
165
-
166
-
167
-
168
-
169
-
170
-
171
-
172
-
173
-
174
-
175
-
176
-
177
-
178
-
179
-
180
-
 181
181 -
 182
182 -
 183
183 -
 184
184 -
 185
185 -
 186
186 -
 187
187 -
 188
188 -
 189
189 -
 190
190 -
 191
191 -
 192
192 -
 193
193 -
 194
194 -
 195
195 -
 196
196 -
 197
197 -
 198
198 -
 199
199 -
 200
200 -
 201
201 -
202
-
203
-
204
-
205
-
206
-
207
-
208
-
209
-
210
-
211
-
212
-
213
-
214
-
215
-
216
-
217
-
218
-
219
-
220
-
221
-
222
-
223
-
224
-
225
-
226
-
227
-
228
-
229
-
230
-
231
-
232
-
233
-
234
-
235
-
236
-
237
-
238
-
239
-
240
-
241
-
242
-
243
-
244
 |
 |

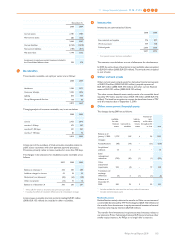
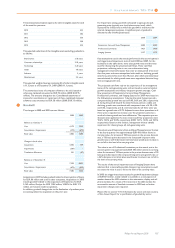
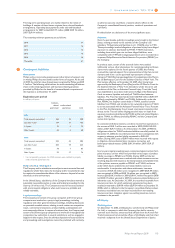
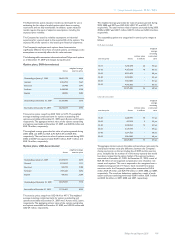
Plan assets in the Netherlands
The Company’s pension plan asset allocation in the Netherlands at
December 31, was as follows:
2008 2009
actual actual
% %
Matching portfolio: 75 76
- Debt securities 75 76
Return portfolio: 25 24
- Equity securities 13 19
- Real estate 4 4
- Other 8 1
100 100
The objective of the Matching portfolio is to match part of the interest
rate sensitivity of the plan’s real pension liabilities. The Matching
portfolio is mainly invested in euro-denominated government bonds
and investment grade debt securities and derivatives. Leverage or
gearing is not permitted. The size of the Matching portfolio is targeted
to be at least 70% of the fair value of the plan’s real pension obligations
(on the assumption of 2% inflation). The objective of the Return
portfolio is to maximize returns within well-specified risk constraints.
The long-term rate of return on total plan assets is expected to be 5.7%
per annum, based on expected long-term returns on debt securities,
equity securities and real estate of 4.5%, 9.0% and 8.0%, respectively.
Philips Pension Fund in the Netherlands
On November 13, 2007, various officials, on behalf of the Public
Prosecutor’s office in the Netherlands, visited a number of offices of the
Philips Pension Fund and the Company in relation to a widespread
investigation into potential fraud in the real estate sector. The Company
was notified that one former employee and one employee of an affiliate
of the Company had been detained. This affiliate, Philips Real Estate
Investment Management B.V., managed the real estate portfolio of the
Philips Pension Fund between 2002 and 2008. The investigation by the
public prosecutor concerns the potential involvement of (former)
employees of a number of Dutch companies with respect to fraud in the
context of certain real estate transactions. Neither the Philips Pension
Fund nor any Philips entity is a suspect in this investigation. The Philips
Pension Fund and Philips are cooperating with the authorities and have
also conducted their own investigation. Formal notifications of
suspected fraud have been filed with the public prosecutor against the
(former) employees concerned and with our insurers. Furthermore,
actions have been taken to claim damages from the responsible
individuals and legal entities. At this time it is not possible to assess the
outcome of this matter nor the potential consequences. At present, it is
management’s assessment that this matter will not cause a decline in
plan assets nor an increase in pension costs in any material respect.
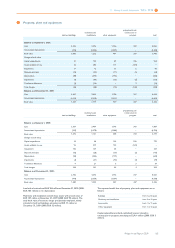
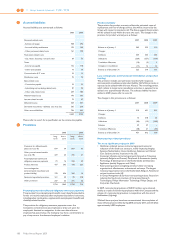
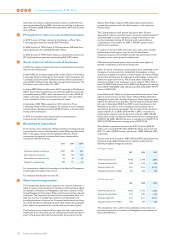
Plan assets in other countries
The Company’s pension plan asset allocation in other countries at
December 31, is shown in the table below. This table also shows the
target allocation for 2010:
2008 2009 2010
actual actual target
% % %
Equity securities 18 19 17
Debt securities 73 76 74
Real estate 3 3 3
Other 6 2 6
100 100 100
Plan assets in 2009 no longer include property occupied by the Philips
Group (2008: EUR 12 million).
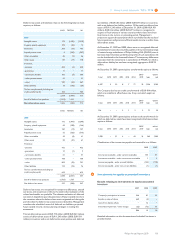
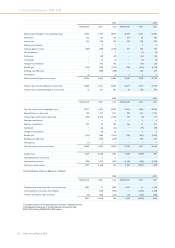
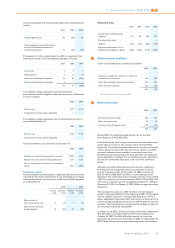
Pension expense of defined-benefit plans recognized in the Consolidated statements of income:
2007 2008 2009
Netherlands other total Netherlands other total Netherlands other total
Service cost 147 118 265 135 84 219 107 75 182
Interest cost on the
defined-benefit obligation 521 399 920 524 398 922 532 395 927
Expected return on plan assets (812) (404) (1,216) (769) (392) (1,161) (758) (343) (1,101)
Prior-service cost − 9 9 − 2 2 − (3) (3)
Settlement loss − (12) (12) − − − − − −
Curtailment benefit − 2 2 − − − − (5) (5)
Other (3) (3) (6) (3) − (3) 2 1 3
(147) 109 (38) (113) 92 (21) (117) 120 3
Amounts recognized in the Consolidated statements of comprehensive
income:
2007 2008 2009
Actuarial (gains) and losses (182) 773 678
Change in the effect of the cap on prepaids 47 772 369
Total recognized in Consolidated
statements of comprehensive income (135) 1,545 1,047
Total recognized in net periodic pension
cost and Consolidated statements of
comprehensive income (173) 1,524 1,050
Actual return on plan assets 645 (794) 1,218
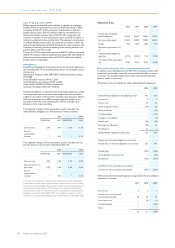
The pension expense of defined-benefit plans is recognized in the
following line items in the Consolidated statements of income:
2007 2008 2009
Cost of sales 5 (23) 7
Selling expenses 31 24 13
General and administrative expenses (75) (23) (14)
Research and development expenses 1 1 (3)
(38) (21) 3
The Company also sponsors defined-contribution and similar types of
plans for a significant number of salaried employees. The total cost of
these plans amounted to EUR 107 million (2008: EUR 96 million, 2007:
EUR 84 million). In 2009, the defined-contribution cost includes
contributions to multi-employer plans of EUR 5 million (2008: EUR 4
million; 2007: EUR 4 million).
11 Group financial statements 11.12 - 11.12
Philips Annual Report 2009 191