Philips 2009 Annual Report Download - page 199
Download and view the complete annual report
Please find page 199 of the 2009 Philips annual report below. You can navigate through the pages in the report by either clicking on the pages listed below, or by using the keyword search tool below to find specific information within the annual report.-
 1
1 -
2
-
3
-
4
-
5
-
6
-
7
-
8
-
9
-
10
-
11
-
12
-
13
-
14
-
15
-
16
-
17
-
18
-
19
-
20
-
21
-
22
-
23
-
24
-
25
-
26
-
27
-
28
-
29
-
30
-
31
-
32
-
33
-
34
-
35
-
36
-
37
-
38
-
39
-
40
-
41
-
42
-
43
-
44
-
45
-
46
-
47
-
48
-
49
-
50
-
51
-
52
-
53
-
54
-
55
-
56
-
57
-
58
-
59
-
60
-
61
-
62
-
63
-
64
-
65
-
66
-
67
-
68
-
69
-
70
-
71
-
72
-
73
-
74
-
75
-
76
-
77
-
78
-
79
-
80
-
81
-
82
-
83
-
84
-
85
-
86
-
87
-
88
-
89
-
90
-
91
-
92
-
93
-
94
-
95
-
96
-
97
-
98
-
99
-
100
-
101
-
102
-
103
-
104
-
105
-
106
-
107
-
108
-
109
-
110
-
111
-
112
-
113
-
114
-
115
-
116
-
117
-
118
-
119
-
120
-
121
-
122
-
123
-
124
-
125
-
126
-
127
-
128
-
129
-
130
-
131
-
132
-
133
-
134
-
135
-
136
-
137
-
138
-
139
-
140
-
141
-
142
-
143
-
144
-
145
-
146
-
147
-
148
-
149
-
150
-
151
-
152
-
153
-
154
-
155
-
156
-
157
-
158
-
159
-
160
-
161
-
162
-
163
-
164
-
165
-
166
-
167
-
168
-
169
-
170
-
171
-
172
-
173
-
174
-
175
-
176
-
177
-
178
-
179
-
180
-
181
-
182
-
183
-
184
-
185
-
186
-
187
-
188
-
 189
189 -
 190
190 -
 191
191 -
 192
192 -
 193
193 -
 194
194 -
 195
195 -
 196
196 -
 197
197 -
 198
198 -
 199
199 -
 200
200 -
 201
201 -
 202
202 -
 203
203 -
 204
204 -
 205
205 -
 206
206 -
 207
207 -
 208
208 -
 209
209 -
210
-
211
-
212
-
213
-
214
-
215
-
216
-
217
-
218
-
219
-
220
-
221
-
222
-
223
-
224
-
225
-
226
-
227
-
228
-
229
-
230
-
231
-
232
-
233
-
234
-
235
-
236
-
237
-
238
-
239
-
240
-
241
-
242
-
243
-
244
 |
 |

The Black-Scholes option valuation model was developed for use in
estimating the fair value of traded options which have no vesting
restrictions and are fully transferable. In addition, option valuation
models require the input of subjective assumptions, including the
expected price volatility.
The Company has based its volatility assumptions on historical
experience for a period equal to the expected life of the options. The
expected life of the options is also based upon historical experience.
The Company’s employee stock options have characteristics
significantly different from those of traded options, and changes in the
assumptions can materially affect the fair value estimate.
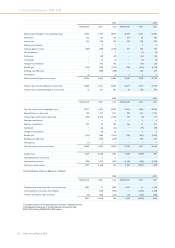
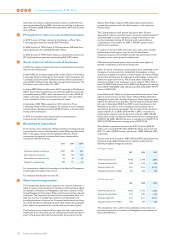
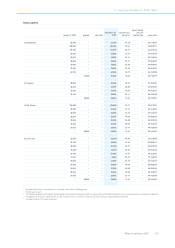
The following tables summarize information about Philips stock options
as of December 31, 2009 and changes during the year:
Option plans, EUR-denominated
shares
weighted average
exercise price
Outstanding at January 1, 2009 36,655,178 28.94
Granted 3,304,793 12.67
Exercised 60,448 17.91
Forfeited 4,436,038 31.28
Expired 88,000 22.85
Outstanding at December 31, 2009 35,375,485 27.16
Exercisable at December 31, 2009 23,258,674 29.45
The exercise prices range from EUR 12.63 to 53.75. The weighted
average remaining contractual term for options outstanding and
options exercisable at December 31, 2009, was 4.8 years and 3.0 years,
respectively. The aggregate intrinsic value of the options outstanding
and options exercisable at December 31, 2009, was EUR 36 million and
EUR 10 million, respectively.
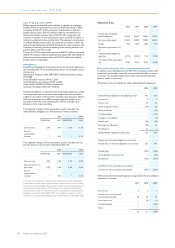
The weighted average grant-date fair value of options granted during
2009, 2008, and 2007 was EUR 2.78, EUR 5.69 and EUR 8.72,
respectively. The total intrinsic value of options exercised during 2009,
2008, and 2007 was approximately EUR 0 million, EUR 1 million and
EUR 16 million, respectively.
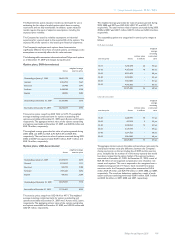
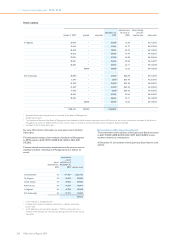
Option plans, USD-denominated
shares
weighted average
exercise price
Outstanding at January 1, 2009 21,004,010 32.75
Granted 2,519,097 17.11
Exercised 220,774 21.88
Forfeited 2181,226 33.42
Expired 446,102 22.89
Outstanding at December 31, 2009 20,675,005 31.10
Exercisable at December 31, 2009 11,795,607 30.29
The exercise prices range from USD 16.41 to 49.71. The weighted
average remaining contractual term for options outstanding and
options exercisable at December 31, 2009, was 5.4 years and 3.2 years,
respectively. The aggregate intrinsic value of the options outstanding
and options exercisable at December 31, 2009, was USD 55 million and
USD 24 million, respectively.
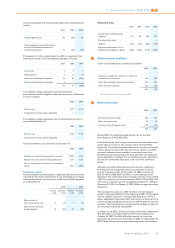
The weighted average grant-date fair value of options granted during
2009, 2008 and 2007 was USD 3.83, USD 7.97 and USD 11.99,
respectively. The total intrinsic value of options exercised during 2009,
2008 and 2007 was USD 1 million, USD 13 million and USD 64 million,
respectively.
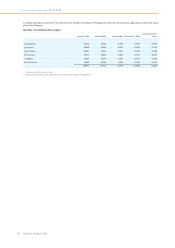
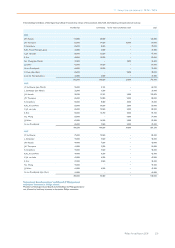
The outstanding options are categorized in exercise price ranges as
follows:
EUR-denominated
exercise price shares
intrinsic value
in millions
weighted
average
remaining
contractual
term
10-15 3,240,678 26 9.3 yrs
15-20 4,353,128 10 4.6 yrs
20-25 8,015,678 − 6.8 yrs
25-30 5,232,483 − 4.3 yrs
30-35 9,557,483 − 4.1 yrs
35-55 4,976,035 − 0.6 yrs
35,375,485 36 4.8 yrs
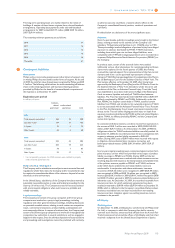
USD-denominated
exercise price shares
intrinsic value
in millions
weighted
average
remaining
contractual
term
15-20 3,228,770 40 7.7 yrs
20-25 422,514 3 2.6 yrs
25-30 4,238,762 12 4.0 yrs
30-35 6,129,149 − 4.9 yrs
35-40 2,591,725 − 7.8 yrs
40-50 4,064,085 − 4.4 yrs
20,675,005 55 5.4 yrs
The aggregate intrinsic value in the tables and text above represents the
total pretax intrinsic value (the difference between the Company’s
closing stock price on the last trading day of 2009 and the exercise
price, multiplied by the number of in-the-money options) that would
have been received by the option holders if the options had been
exercised on December 31, 2009. At December 31, 2009, a total of
EUR 38 million of unrecognized compensation cost related to non-
vested stock options. This cost is expected to be recognized over a
weighted-average period of 1.4 years. Cash received from option
exercises under the Company’s option plans amounted to EUR 4
million, EUR 24 million and EUR 140 million in 2009, 2008, and 2007,
respectively. The actual tax deductions realized as a result of stock
option exercises totaled approximately EUR 0 million, EUR 3 million
and EUR 36 million, in 2009, 2008, and 2007, respectively.
11 Group financial statements 11.12 - 11.12
Philips Annual Report 2009 199