Philips 2009 Annual Report Download - page 198
Download and view the complete annual report
Please find page 198 of the 2009 Philips annual report below. You can navigate through the pages in the report by either clicking on the pages listed below, or by using the keyword search tool below to find specific information within the annual report.-
 1
1 -
2
-
3
-
4
-
5
-
6
-
7
-
8
-
9
-
10
-
11
-
12
-
13
-
14
-
15
-
16
-
17
-
18
-
19
-
20
-
21
-
22
-
23
-
24
-
25
-
26
-
27
-
28
-
29
-
30
-
31
-
32
-
33
-
34
-
35
-
36
-
37
-
38
-
39
-
40
-
41
-
42
-
43
-
44
-
45
-
46
-
47
-
48
-
49
-
50
-
51
-
52
-
53
-
54
-
55
-
56
-
57
-
58
-
59
-
60
-
61
-
62
-
63
-
64
-
65
-
66
-
67
-
68
-
69
-
70
-
71
-
72
-
73
-
74
-
75
-
76
-
77
-
78
-
79
-
80
-
81
-
82
-
83
-
84
-
85
-
86
-
87
-
88
-
89
-
90
-
91
-
92
-
93
-
94
-
95
-
96
-
97
-
98
-
99
-
100
-
101
-
102
-
103
-
104
-
105
-
106
-
107
-
108
-
109
-
110
-
111
-
112
-
113
-
114
-
115
-
116
-
117
-
118
-
119
-
120
-
121
-
122
-
123
-
124
-
125
-
126
-
127
-
128
-
129
-
130
-
131
-
132
-
133
-
134
-
135
-
136
-
137
-
138
-
139
-
140
-
141
-
142
-
143
-
144
-
145
-
146
-
147
-
148
-
149
-
150
-
151
-
152
-
153
-
154
-
155
-
156
-
157
-
158
-
159
-
160
-
161
-
162
-
163
-
164
-
165
-
166
-
167
-
168
-
169
-
170
-
171
-
172
-
173
-
174
-
175
-
176
-
177
-
178
-
179
-
180
-
181
-
182
-
183
-
184
-
185
-
186
-
187
-
 188
188 -
 189
189 -
 190
190 -
 191
191 -
 192
192 -
 193
193 -
 194
194 -
 195
195 -
 196
196 -
 197
197 -
 198
198 -
 199
199 -
 200
200 -
 201
201 -
 202
202 -
 203
203 -
 204
204 -
 205
205 -
 206
206 -
 207
207 -
 208
208 -
209
-
210
-
211
-
212
-
213
-
214
-
215
-
216
-
217
-
218
-
219
-
220
-
221
-
222
-
223
-
224
-
225
-
226
-
227
-
228
-
229
-
230
-
231
-
232
-
233
-
234
-
235
-
236
-
237
-
238
-
239
-
240
-
241
-
242
-
243
-
244
 |
 |

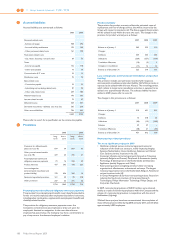
Cash flow from interest-related derivatives is part of cash flow from
operating activities. During 2009, there was no cash flow in relation to
these derivatives (2008: EUR 28 million cash inflow; 2007: EUR 2 million
cash outflow).
27 Proceeds from other non-current financial assets
In 2009, the sale of Philips’ interests in LG Display and Pace Micro
Technology generated cash totaling EUR 704 million.
In 2008, the sale of TSMC shares, LG Display shares, D&M and Pace
shares generated cash totaling EUR 2,553 million.
In 2007, the sale of TSMC shares, Nuance communication shares and
JDS Uniphase shares generated cash totaling EUR 4,002 million.
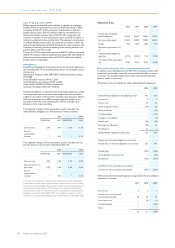
28 Assets in lieu of cash from sale of businesses
In 2009, the company received only cash as consideration in connection
with the sale of businesses.
In April 2008, the Company acquired 64.5 million shares in Pace Micro
Technology (Pace) in exchange for the transfer of the Company’s Set-
Top Boxes and Connectivity Solutions activities, which represented a
value of EUR 74 million at the date of the closing of that transaction. The
Pace shares were sold on April 17, 2009.
In August 2008, Philips transferred its 69.5% ownership in MedQuist to
CBAY. A part of the consideration was settled through the issuance of a
convertible bond by CBAY which represented a fair value of EUR 53
million at the date of the closing of the transaction. The convertible
bond is included in Other non-current financial assets.
In September 2008, Philips acquired a 33.5% interest in Prime
Technology Ventures III in exchange for the transfer of seven incubator
activities which represented a value of EUR 21 million at the date of the
closing of that transaction.
In 2007, the Company only received cash as consideration in
connection with the sale of businesses.
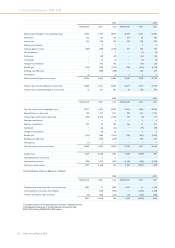
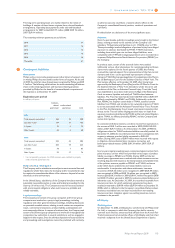
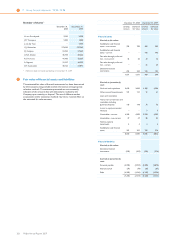
29 Related-party transactions
In the normal course of business, Philips purchases and sells goods and
services from/to various related parties in which Philips typically holds a
50% or less equity interest and has significant influence. These
transactions are generally conducted with terms comparable to
transactions with third parties.
2007 2008 2009
Purchases of goods and services 1,837 692 424
Sales of goods and services 168 174 150
Receivables from related parties 26 24 14
Payables to related parties 289 112 95
For remuneration details of the members of the Board of Management
and the Supervisory Board see note 31.
For employee benefit plans see note 18.
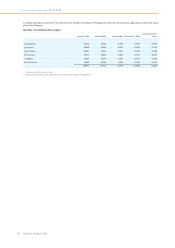
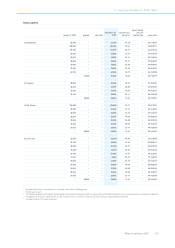
30 Share-based compensation
The Company has granted stock options on its common shares and
rights to receive common shares in the future (restricted share rights)
to members of the Board of Management and other members of the
Group Management Committee, Philips executives and certain selected
employees. The purpose of the share-based compensation plans is to
align the interests of management with those of shareholders by
providing incentives to improve the Company’s performance on a long-
term basis, thereby increasing shareholder value. Under the Company’s
plans, options are granted at fair market value on the date of grant.
The Company issues restricted share rights that vest in equal annual
installments over a three-year period, starting one year after the date of
grant. If the grantee still holds the shares after three years from the
delivery date, Philips will grant 20% additional (premium) shares,
provided the grantee is still with the Company on the respective
delivery dates.
The Company grants stock options that expire after 10 years.
Generally, the options vest after 3 years; however, a limited number of
options granted to certain employees of acquired businesses may
contain accelerated vesting. Of the total stock options that are
outstanding as of December 31, 2009, 2,720,000 options contain
performance conditions.
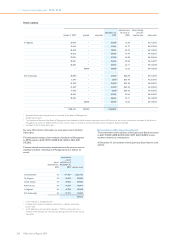
In contrast to the year 2001 and certain prior years, when variable
(performance) stock options were issued, the share-based
compensation grants as from 2002 consider the performance of the
Company versus a peer group of multinationals.
USD-denominated stock options and restricted share rights are
granted to employees in the United States only.
Under the terms of employee stock purchase plans established by the
Company in various countries, substantially all employees in those
countries are eligible to purchase a limited number of shares of Philips
stock at discounted prices through payroll withholdings, of which the
maximum ranges from 8.5% to 10% of total salary. Generally, the
discount provided to the employees is in the range of 10% to 20%. A
total of 2,185,647 shares were sold in 2009 under the plan at an average
price of EUR 13.30 (2008: 1,051,206 shares at EUR 21.82, 2007: 707,717
shares at EUR 29.99).
In the Netherlands, Philips issued personnel debentures with a 2-year
right of conversion into common shares of Royal Philips Electronics
starting three years after the date of issuance, with a conversion price
equal to the share price on that date. The last issuance of this particular
plan was in December 2008. From 2009 onwards employees in the
Netherlands are able to join an employee stock purchase plan as
described in the previous paragraph. The fair value of the conversion
option of EUR 2.13 in 2008, and EUR 4.01 in 2007, is recorded as
compensation expense over the period of vesting. In 2009, 183,330
shares were issued in conjunction with conversions at an average price
of EUR 19.56 (2008: 485,331 shares at an average price of EUR 19.13,
2007: 2,019,788 shares at an average price of EUR 18.94).
Share-based compensation expense was EUR 94 million (EUR 86
million, net of tax), EUR 78 million (EUR 106 million, net of tax) and
EUR 111 million (EUR 84 million, net of tax) in 2009, 2008 and 2007,
respectively.
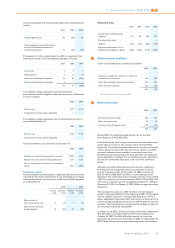
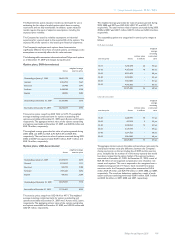
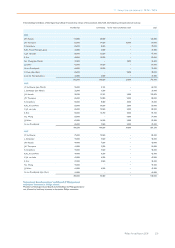
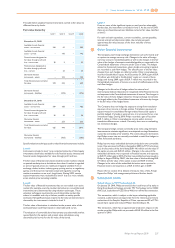
The fair value of the Company’s 2009, 2008 and 2007 option grants was
estimated using a Black-Scholes option valuation model and the
following weighted average assumptions:
EUR-denominated
2007 2008 2009
Risk-free interest rate 4.18% 3.75% 2.88%
Expected dividend yield 1.8% 2.4% 4.3%
Expected option life 6 yrs 6 yrs 6.5 yrs
Expected stock price volatility 27% 26% 32%
USD-denominated
2007 2008 2009
Risk-free interest rate 3.96% 3.17% 2.25%
Expected dividend yield 1.7% 2.8% 4.1%
Expected option life 6 yrs 6 yrs 6.5 yrs
Expected stock price volatility 28% 27% 33%
The assumptions were used for these calculations only and do not
necessarily represent an indication of Management’s expectations of
future developments.
27 28 29 30 11 Group financial statements 11.12 - 11.12
198 Philips Annual Report 2009