Philips 2009 Annual Report Download - page 182
Download and view the complete annual report
Please find page 182 of the 2009 Philips annual report below. You can navigate through the pages in the report by either clicking on the pages listed below, or by using the keyword search tool below to find specific information within the annual report.-
 1
1 -
2
-
3
-
4
-
5
-
6
-
7
-
8
-
9
-
10
-
11
-
12
-
13
-
14
-
15
-
16
-
17
-
18
-
19
-
20
-
21
-
22
-
23
-
24
-
25
-
26
-
27
-
28
-
29
-
30
-
31
-
32
-
33
-
34
-
35
-
36
-
37
-
38
-
39
-
40
-
41
-
42
-
43
-
44
-
45
-
46
-
47
-
48
-
49
-
50
-
51
-
52
-
53
-
54
-
55
-
56
-
57
-
58
-
59
-
60
-
61
-
62
-
63
-
64
-
65
-
66
-
67
-
68
-
69
-
70
-
71
-
72
-
73
-
74
-
75
-
76
-
77
-
78
-
79
-
80
-
81
-
82
-
83
-
84
-
85
-
86
-
87
-
88
-
89
-
90
-
91
-
92
-
93
-
94
-
95
-
96
-
97
-
98
-
99
-
100
-
101
-
102
-
103
-
104
-
105
-
106
-
107
-
108
-
109
-
110
-
111
-
112
-
113
-
114
-
115
-
116
-
117
-
118
-
119
-
120
-
121
-
122
-
123
-
124
-
125
-
126
-
127
-
128
-
129
-
130
-
131
-
132
-
133
-
134
-
135
-
136
-
137
-
138
-
139
-
140
-
141
-
142
-
143
-
144
-
145
-
146
-
147
-
148
-
149
-
150
-
151
-
152
-
153
-
154
-
155
-
156
-
157
-
158
-
159
-
160
-
161
-
162
-
163
-
164
-
165
-
166
-
167
-
168
-
169
-
170
-
171
-
 172
172 -
 173
173 -
 174
174 -
 175
175 -
 176
176 -
 177
177 -
 178
178 -
 179
179 -
 180
180 -
 181
181 -
 182
182 -
 183
183 -
 184
184 -
 185
185 -
 186
186 -
 187
187 -
 188
188 -
 189
189 -
 190
190 -
 191
191 -
 192
192 -
193
-
194
-
195
-
196
-
197
-
198
-
199
-
200
-
201
-
202
-
203
-
204
-
205
-
206
-
207
-
208
-
209
-
210
-
211
-
212
-
213
-
214
-
215
-
216
-
217
-
218
-
219
-
220
-
221
-
222
-
223
-
224
-
225
-
226
-
227
-
228
-
229
-
230
-
231
-
232
-
233
-
234
-
235
-
236
-
237
-
238
-
239
-
240
-
241
-
242
-
243
-
244
 |
 |

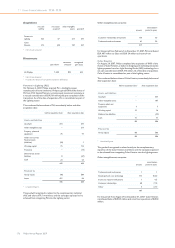
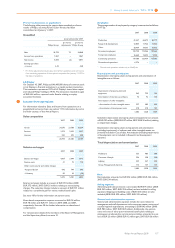
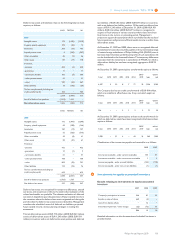
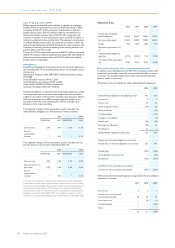
Company’s participation in income
2007 2008 2009
LG Display 241 66 −
Others 5 15 23
246 81 23
Philips’ influence on LG Display’s operating and financial policies
including representation on the LG Display board was reduced in
February 2008. Consequently, the investment in LG Display (at that
date 19.9%) was transferred from Investments in equity-accounted
investees to Other non-current financial assets, as Philips was no longer
able to exercise significant influence.
Results on sales of shares
2007 2008 2009
LG Display 654 − −
Others 6 (2) −
660 (2) −
In 2007, Philips sold 46,400,000 shares of LG Display’s common stock,
resulting in a gain of EUR 654 million. As a result of the sale, Philips’
shareholding in LG Display was reduced from 32.9% to 19.9%.
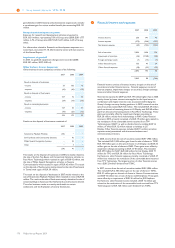
Investment impairment/other charges
2007 2008 2009
LG.Philips Displays (22) (9) −
TPV Technology Ltd. − (59) 55
Others − (4) (2)
(22) (72) 53
In 2009, the TPV Technology Ltd. impairment charge of 2008 was
reversed (EUR 55 million) based on the 2009 stock price.
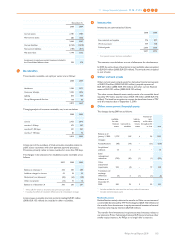
In 2008, the category ‘Others’ included an impairment charge related to
our 12.4% interest in TPV Technology Ltd. (TPV). Philips performed
impairment reviews on the book value of the investment in TPV in 2008
resulting in an impairment charge of EUR 59 million. The impairment
reviews in 2008 were triggered by the deteriorating economic
environment of the flat panel industry, the weakening financial
performance of TPV and the stock price performance of TPV. The
valuation as per December 31, 2008 was based on the stock price of
TPV as of that date on the Hong Kong Stock Exchange.
In 2007, the voluntary support of social plans for employees impacted
by the bankruptcy of certain activities of LG.Philips Displays (formerly a
leading CRT manufacturer) amounted to EUR 22 million.
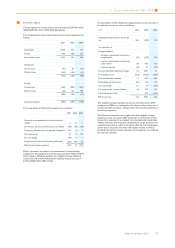
Investments in equity-accounted investees
The changes during 2009 are as follows:
Investments in equity-accounted investees
loans investments total
Balance as of January 1, 2009 − 293 293
Changes:
Acquisitions/additions 8 2 10
Sales/repayments − (3) (3)
Transfer to other non-current
financial assets − (43) (43)
Share in income/value
adjustments − 23 23
Impairments and reversal of
impairments − 52 52
Dividends received − (35) (35)
Consolidation changes − (7) (7)
Translation and exchange rate
differences (1) (8) (9)
Balance as of December 31,
2009 7 274 281
The EUR 43 million reported on Transfer to other non-current financial
assets relates to our interest in Prime Technology Ventures III (Prime)
and various other smaller equity interests. As Philips is no longer able to
exercise significant influence with respect to these entities, the book
value was transferred to Other non-current financial assets effective
January 1, 2009.
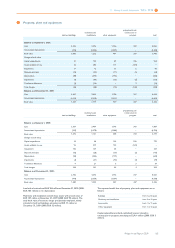
The two major equity-accounted investees are TPV (12.4%, carrying
value EUR 119 million) and InterTrust Technologies Corporation
(49.5%, carrying value EUR 50 million). The remainder of the portfolio
exists of equity interests which individually have carrying values below
EUR 50 million.
The Company owns TPV bonds which have convertible rights.
The investments in equity-accounted investees are mainly included in
the Group Management & Services sector.
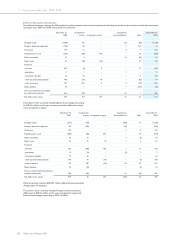
Summarized information of investments in equity-accounted
investees
Summarized financial information on the Company’s investments in
equity-accounted investees, on a combined basis, is presented below:
2007 2008 2009
Net sales 15,799 6,951 4,165
Income before taxes 1,233 538 142
Income taxes (154) (109) (30)
Other income (loss) (1) − (6)
Net income 1,078 429 106
Total share in net income of equity-
accounted investees recognized in the
Consolidated statements of income 246 81 23
11 Group financial statements 11.12 - 11.12
182 Philips Annual Report 2009