Philips 2009 Annual Report Download - page 61
Download and view the complete annual report
Please find page 61 of the 2009 Philips annual report below. You can navigate through the pages in the report by either clicking on the pages listed below, or by using the keyword search tool below to find specific information within the annual report.-
 1
1 -
2
-
3
-
4
-
5
-
6
-
7
-
8
-
9
-
10
-
11
-
12
-
13
-
14
-
15
-
16
-
17
-
18
-
19
-
20
-
21
-
22
-
23
-
24
-
25
-
26
-
27
-
28
-
29
-
30
-
31
-
32
-
33
-
34
-
35
-
36
-
37
-
38
-
39
-
40
-
41
-
42
-
43
-
44
-
45
-
46
-
47
-
48
-
49
-
50
-
 51
51 -
 52
52 -
 53
53 -
 54
54 -
 55
55 -
 56
56 -
 57
57 -
 58
58 -
 59
59 -
 60
60 -
 61
61 -
 62
62 -
 63
63 -
 64
64 -
 65
65 -
 66
66 -
 67
67 -
 68
68 -
 69
69 -
 70
70 -
 71
71 -
72
-
73
-
74
-
75
-
76
-
77
-
78
-
79
-
80
-
81
-
82
-
83
-
84
-
85
-
86
-
87
-
88
-
89
-
90
-
91
-
92
-
93
-
94
-
95
-
96
-
97
-
98
-
99
-
100
-
101
-
102
-
103
-
104
-
105
-
106
-
107
-
108
-
109
-
110
-
111
-
112
-
113
-
114
-
115
-
116
-
117
-
118
-
119
-
120
-
121
-
122
-
123
-
124
-
125
-
126
-
127
-
128
-
129
-
130
-
131
-
132
-
133
-
134
-
135
-
136
-
137
-
138
-
139
-
140
-
141
-
142
-
143
-
144
-
145
-
146
-
147
-
148
-
149
-
150
-
151
-
152
-
153
-
154
-
155
-
156
-
157
-
158
-
159
-
160
-
161
-
162
-
163
-
164
-
165
-
166
-
167
-
168
-
169
-
170
-
171
-
172
-
173
-
174
-
175
-
176
-
177
-
178
-
179
-
180
-
181
-
182
-
183
-
184
-
185
-
186
-
187
-
188
-
189
-
190
-
191
-
192
-
193
-
194
-
195
-
196
-
197
-
198
-
199
-
200
-
201
-
202
-
203
-
204
-
205
-
206
-
207
-
208
-
209
-
210
-
211
-
212
-
213
-
214
-
215
-
216
-
217
-
218
-
219
-
220
-
221
-
222
-
223
-
224
-
225
-
226
-
227
-
228
-
229
-
230
-
231
-
232
-
233
-
234
-
235
-
236
-
237
-
238
-
239
-
240
-
241
-
242
-
243
-
244
 |
 |

In addition to the annual goodwill impairment tests for
Philips, due to the economic circumstances trigger-based
impairment tests were performed during the year,
resulting in no goodwill impairments. For further
information on sensitivity analysis, please refer to note 15
in the Group financial statements. In 2008 there were
EUR 301 million of non-cash goodwill impairment charges,
mainly related to Lumileds.
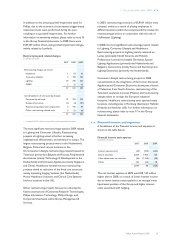
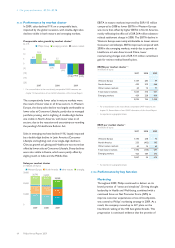
Restructuring and related charges
in millions of euros
2007 2008 2009
Restructuring charges per sector:
Healthcare 1 63 42
Consumer Lifestyle 7 198 120
Lighting 24 245 225
GM&S 5 35 63
37 541 450
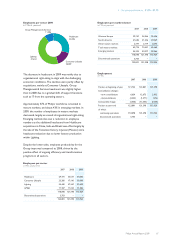
Cost breakdown of restructuring charges:
Personnel lay-off costs 35 374 399
Release of provision (5) (2) (81)
Restructuring-related asset impairment 4 116 84
Other restructuring-related costs 3 53 481)
37 541 450
1) Includes EUR 22 million of costs which were expensed as incurred
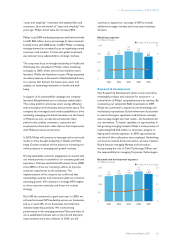
The most significant restructuring projects in 2009 related
to Lighting and Consumer Lifestyle. Restructuring
projects at Lighting aimed at further increasing
organizational effectiveness, and centered on Lamps. The
largest restructuring projects were in the Netherlands,
Belgium, Poland and various locations in the
US. Consumer Lifestyle restructuring projects focused on
Television (primarily in Belgium and France), Peripherals &
Accessories (mainly Technology & Development in the
Netherlands) and Domestic Appliances (mainly Singapore
and China). Healthcare initiated various restructuring
projects aimed at reduction of the fixed cost structure,
mainly impacting Imaging Systems (the Netherlands),
Home Healthcare Solutions and Clinical Care Systems
(various locations in the US).
Other restructuring projects focused on reducing the
fixed cost structure of Corporate Research Technologies,
Philips Information Technology, Philips Design, and
Corporate Overheads within Group Management &
Services.
In 2009, restructuring provisions of EUR 81 million were
released, mainly as a result of placing employees in
different positions within the company and the release of a
restructuring provision in conjunction with the sale of
Hoffmeister (Lighting).
In 2008, the most significant restructuring projects related
to Lighting, Consumer Lifestyle and Healthcare.
Restructuring projects at Lighting mainly centered on
Lamps (principally North America and Poland),
Professional Luminaires (notably Germany), Special
Lighting Applications (primarily the Netherlands and
Belgium), Automotive (mainly Korea and Germany) and
Lighting Electronics (primarily the Netherlands).
Consumer Lifestyle restructuring projects in 2008
concentrated on the integration of the former Domestic
Appliances and Consumer Electronics businesses, the exit
of Television from North America, restructuring of the
Television operation in Juarez (Mexico) and restructuring
charges taken to re-align the European industrial
footprint. Healthcare restructuring costs spanned many
locations, including sites in Hamburg (Germany), Helsinki
(Finland) and Andover (US). For further information on
restructuring, please refer to note 17 in the Group
financial statements.
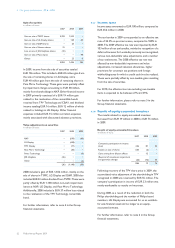
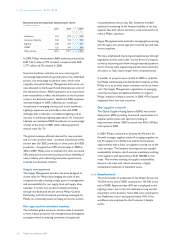
4.1.6 Financial income and expenses
A breakdown of the Financial income and expenses is
shown in the table below.
Financial income and expenses
in millions of euros
2007 2008 2009
Interest expense (net) (43) (105) (252)
Sale of securities 2,804 1,406 126
Value adjustments on securities (36) (1,148) (58)
Other 124 (65) 18
2,849 88 (166)
The net interest expense in 2009 was EUR 147 million
higher than in 2008, as a result of lower interest income
due to lower interest rates applied to an average lower
liquid asset position of the Group and higher interest
costs associated with hedging.
4 Our group performance 4.1.5 - 4.1.6
Philips Annual Report 2009 61