Philips 2009 Annual Report Download - page 98
Download and view the complete annual report
Please find page 98 of the 2009 Philips annual report below. You can navigate through the pages in the report by either clicking on the pages listed below, or by using the keyword search tool below to find specific information within the annual report.-
 1
1 -
2
-
3
-
4
-
5
-
6
-
7
-
8
-
9
-
10
-
11
-
12
-
13
-
14
-
15
-
16
-
17
-
18
-
19
-
20
-
21
-
22
-
23
-
24
-
25
-
26
-
27
-
28
-
29
-
30
-
31
-
32
-
33
-
34
-
35
-
36
-
37
-
38
-
39
-
40
-
41
-
42
-
43
-
44
-
45
-
46
-
47
-
48
-
49
-
50
-
51
-
52
-
53
-
54
-
55
-
56
-
57
-
58
-
59
-
60
-
61
-
62
-
63
-
64
-
65
-
66
-
67
-
68
-
69
-
70
-
71
-
72
-
73
-
74
-
75
-
76
-
77
-
78
-
79
-
80
-
81
-
82
-
83
-
84
-
85
-
86
-
87
-
 88
88 -
 89
89 -
 90
90 -
 91
91 -
 92
92 -
 93
93 -
 94
94 -
 95
95 -
 96
96 -
 97
97 -
 98
98 -
 99
99 -
 100
100 -
 101
101 -
 102
102 -
 103
103 -
 104
104 -
 105
105 -
 106
106 -
 107
107 -
 108
108 -
109
-
110
-
111
-
112
-
113
-
114
-
115
-
116
-
117
-
118
-
119
-
120
-
121
-
122
-
123
-
124
-
125
-
126
-
127
-
128
-
129
-
130
-
131
-
132
-
133
-
134
-
135
-
136
-
137
-
138
-
139
-
140
-
141
-
142
-
143
-
144
-
145
-
146
-
147
-
148
-
149
-
150
-
151
-
152
-
153
-
154
-
155
-
156
-
157
-
158
-
159
-
160
-
161
-
162
-
163
-
164
-
165
-
166
-
167
-
168
-
169
-
170
-
171
-
172
-
173
-
174
-
175
-
176
-
177
-
178
-
179
-
180
-
181
-
182
-
183
-
184
-
185
-
186
-
187
-
188
-
189
-
190
-
191
-
192
-
193
-
194
-
195
-
196
-
197
-
198
-
199
-
200
-
201
-
202
-
203
-
204
-
205
-
206
-
207
-
208
-
209
-
210
-
211
-
212
-
213
-
214
-
215
-
216
-
217
-
218
-
219
-
220
-
221
-
222
-
223
-
224
-
225
-
226
-
227
-
228
-
229
-
230
-
231
-
232
-
233
-
234
-
235
-
236
-
237
-
238
-
239
-
240
-
241
-
242
-
243
-
244
 |
 |
the consumer domain, Philips has leveraged the strengths
of its segmented sales, marketing and R&D organizations,
driving leadership in its key markets.
We see tremendous value in partnership, both with
clients and suppliers, based on trust and mutual benefit.
For example, we work closely with individual retailers to
make sure that our on-shelf product placement not only
enhances the customer experience, but also improves
sales by utilizing specific point-of-purchase materials and
purpose-designed shelf layouts.
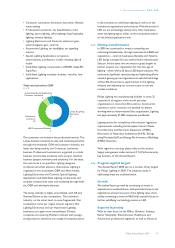
Brand franchise
Philips Lighting increased its brand franchise by leveraging
category management and brand equity in 2009. In the
consumer space, for example, Philips Consumer
Luminaires addresses different consumer needs at
different price points with a number of brands and
concepts. The focus is on Philips as the master brand,
bringing all-new innovations, based on LED, in product
range solutions such as LivingColors, Ledino and
EcoMoods. These portfolios enable consumers to
transform their home environment and create ambience
with lighting. In the premium space, led by design, Philips is
marketing its product range under the name ‘Lirio by
Philips’.
New business models
The changing industry landscape presents opportunities
for new ways of working and new forms of revenue
generation, for instance by expanding our business with
value-added service offerings. Philips Lighting
strengthened its proposition as a services-solutions
provider with Philips Lightolier, one of the businesses
acquired through the 2008 acquisition of Genlyte,
launching a commercial energy audit and lighting upgrade
program in the US aimed at replacing inefficient lighting
systems currently found in 85% of buildings. A key
element of the program, which is being led by the Philips
Lightolier Energy Services Group, is a guarantee that the
energy audit will deliver measurable energy cost
reduction, defined projected return on investment and
itemized economic payback, among other benefits. The
program is built around the principle of both improving
the quality of light and delivering energy efficiencies.
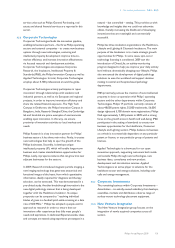
Intellectual property
Philips makes its patent portfolio for LED systems and
controls available to third parties via a licensing program
in order to foster industry growth. Philips reached license
agreements with several lighting peers including Acuity
and Zumtobel in 2009; a similar agreement with Osram
has been in place since 2008.
A good example of Philips Lighting’s technological
prowess and intellectual property strength is that Philips
was the first entrant to the Bright Tomorrow Lighting
Prize (L Prize) competition organized by the US
Department of Energy. As part of this industry-wide
challenge, Philips has developed, manufactured and will
bring to market an LED replacement for the common
60W incandescent light bulb. “With the flick of a switch,
Philips may have just dramatically lowered America’s
electric bill,” TIME Magazine commented after naming this
LED lamp the 3rd best invention of 2009.
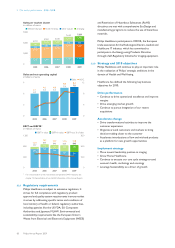
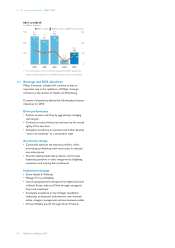
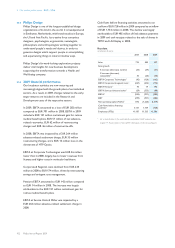
5.4.7 2009 financial performance
Sales in 2009 amounted to EUR 6,546 million, a nominal
decline of 11% compared to 2008, impacted by weakened
automotive, construction, consumer and OEM markets.
Excluding a 1% favorable currency impact and a 1%
favorable effect of portfolio changes, comparable sales
declined 13%.
The year-on-year sales decline was visible in all markets. In
mature markets, sales were 15% below the level of 2008
due to double-digit declines in North America and
Western Europe, particularly at Professional Luminaires,
which was impacted by weakened construction markets.
The emerging markets, which accounted for 34% of
Lighting sales compared to 32% in 2008, declined 7%
mainly due to lower sales in Latin America and Russia,
partly offset by single-digit growth in China and India.
Sales declines were most severe at Professional
Luminaires, Lighting Electronics and Automotive, which
experienced double-digit decreases. Sequential
improvement was seen throughout the year with fourth-
quarter comparable sales being on par with the fourth
quarter in 2008. Green Product sales totaled EUR 3,393
million, a nominal increase of 14% compared to 2008,
amounting to 52% of sales.
EBITA amounted to EUR 145 million, which included EUR
247 million of restructuring and acquisition-related
charges. This compared to EUR 480 million in 2008, which
included EUR 285 million of restructuring and acquisition-
related charges. The decline in EBITA was largely
attributable to lower sales and gross margin.
EBIT declined from a profit of EUR 24 million in 2008 to a
loss of EUR 16 million due to lower sales. 2008 included
EUR 301 million of non-cash goodwill impairments, mainly
related to Lumileds.
Net operating capital decreased by EUR 608 million to
EUR 5.1 billion, mainly driven by improved working capital
management and lower capital investments.
5 Our sector performance 5.4.6 - 5.4.7
98 Philips Annual Report 2009