Philips 2009 Annual Report Download - page 125
Download and view the complete annual report
Please find page 125 of the 2009 Philips annual report below. You can navigate through the pages in the report by either clicking on the pages listed below, or by using the keyword search tool below to find specific information within the annual report.-
 1
1 -
2
-
3
-
4
-
5
-
6
-
7
-
8
-
9
-
10
-
11
-
12
-
13
-
14
-
15
-
16
-
17
-
18
-
19
-
20
-
21
-
22
-
23
-
24
-
25
-
26
-
27
-
28
-
29
-
30
-
31
-
32
-
33
-
34
-
35
-
36
-
37
-
38
-
39
-
40
-
41
-
42
-
43
-
44
-
45
-
46
-
47
-
48
-
49
-
50
-
51
-
52
-
53
-
54
-
55
-
56
-
57
-
58
-
59
-
60
-
61
-
62
-
63
-
64
-
65
-
66
-
67
-
68
-
69
-
70
-
71
-
72
-
73
-
74
-
75
-
76
-
77
-
78
-
79
-
80
-
81
-
82
-
83
-
84
-
85
-
86
-
87
-
88
-
89
-
90
-
91
-
92
-
93
-
94
-
95
-
96
-
97
-
98
-
99
-
100
-
101
-
102
-
103
-
104
-
105
-
106
-
107
-
108
-
109
-
110
-
111
-
112
-
113
-
114
-
 115
115 -
 116
116 -
 117
117 -
 118
118 -
 119
119 -
 120
120 -
 121
121 -
 122
122 -
 123
123 -
 124
124 -
 125
125 -
 126
126 -
 127
127 -
 128
128 -
 129
129 -
 130
130 -
 131
131 -
 132
132 -
 133
133 -
 134
134 -
 135
135 -
136
-
137
-
138
-
139
-
140
-
141
-
142
-
143
-
144
-
145
-
146
-
147
-
148
-
149
-
150
-
151
-
152
-
153
-
154
-
155
-
156
-
157
-
158
-
159
-
160
-
161
-
162
-
163
-
164
-
165
-
166
-
167
-
168
-
169
-
170
-
171
-
172
-
173
-
174
-
175
-
176
-
177
-
178
-
179
-
180
-
181
-
182
-
183
-
184
-
185
-
186
-
187
-
188
-
189
-
190
-
191
-
192
-
193
-
194
-
195
-
196
-
197
-
198
-
199
-
200
-
201
-
202
-
203
-
204
-
205
-
206
-
207
-
208
-
209
-
210
-
211
-
212
-
213
-
214
-
215
-
216
-
217
-
218
-
219
-
220
-
221
-
222
-
223
-
224
-
225
-
226
-
227
-
228
-
229
-
230
-
231
-
232
-
233
-
234
-
235
-
236
-
237
-
238
-
239
-
240
-
241
-
242
-
243
-
244
 |
 |

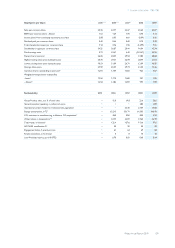
7.5 Performance in relation to market indices
Euronext Amsterdam
Share price development in Amsterdam, 2009 (in euros)
PHIA Jan Feb Mar Apr May Jun Jul Aug Sep Oct Nov Dec
High 15.26 16.05 12.74 13.76 14.77 14.23 15.88 16.54 17.65 18.91 18.84 21.03
Low 12.61 12.58 10.95 11.52 13.26 12.64 12.59 15.61 15.05 15.79 16.99 19.21
Average 14.03 14.34 11.99 12.68 14.01 13.43 14.18 16.15 16.63 17.55 18.13 20.14
Average daily volume* 9.52 9.49 11.60 9.17 5.86 6.21 6.57 5.35 7.21 8.20 5.56 5.92
New York Stock Exchange
Share price development in New York, 2009 (in US dollar)
PHG Jan Feb Mar Apr May Jun Jul Aug Sep Oct Nov Dec
High 20.73 20.78 17.13 17.98 19.89 20.30 22.76 23.83 25.82 28.14 28.46 30.19
Low 16.06 15.58 13.98 15.45 18.11 17.61 17.52 22.15 21.35 22.89 25.09 28.58
Average 18.73 18.31 15.66 16.75 19.16 18.81 19.99 23.03 24.19 25.95 27.09 29.29
Average daily volume* 1.21 1.58 1.76 1.60 1.03 0.89 1.32 0.74 0.90 0.73 0.55 0.70
* in millions of shares
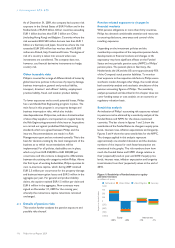
5-year relative performance: Philips and AEX
base 100 = Dec 31, 2004
Jan ‘05 Dec ‘09
0
AEXPhilips Amsterdam closing share price
monthly traded volume in Philips on AEX, in millions
0
75
225
150
300
50
150
100
200
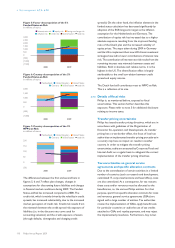
5-year relative performance: Philips and unweighted
TSR peer group index base 100 = Dec 31, 2004
Jan ‘05 Dec ‘09
0
TSR peer groupPhilips Amsterdam closing share price
3M, Electrolux, Emerson, GE, Hitachi, Honeywell, Johnson & Johnson, Panasonic,
Schneider, Siemens, Toshiba,
50
150
100
200
5-year relative performance: Philips and Dow Jones
base 100 = Dec 31, 2004
Jan ‘05 Dec ‘09
0
DJPhilips NY closing share price
monthly traded volume in Philips on Dow Jones, in millions
0
10
30
20
40
50
150
100
200
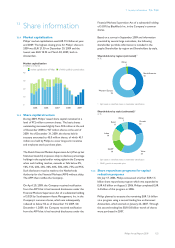
Share listings
Amsterdam, New
York
Ticker code PHIA, PHG
No. of shares issued at Dec. 31, 2009 972 million
No. of shares outstanding issued at Dec. 31, 2009 927 million
Market capitalization at year-end 2009 19.2 billion
Industry classification
MSCI: Capital Goods, Diversified Industrials 20105010
ICB: Consumer Electronics1) 3743
Members of indices
AEX, NYSE, DJSI, and others
1) ICB classification based on 2007 sales split
7 Investor information 7.5 - 7.5
Philips Annual Report 2009 125