Philips 2009 Annual Report Download - page 75
Download and view the complete annual report
Please find page 75 of the 2009 Philips annual report below. You can navigate through the pages in the report by either clicking on the pages listed below, or by using the keyword search tool below to find specific information within the annual report.-
 1
1 -
2
-
3
-
4
-
5
-
6
-
7
-
8
-
9
-
10
-
11
-
12
-
13
-
14
-
15
-
16
-
17
-
18
-
19
-
20
-
21
-
22
-
23
-
24
-
25
-
26
-
27
-
28
-
29
-
30
-
31
-
32
-
33
-
34
-
35
-
36
-
37
-
38
-
39
-
40
-
41
-
42
-
43
-
44
-
45
-
46
-
47
-
48
-
49
-
50
-
51
-
52
-
53
-
54
-
55
-
56
-
57
-
58
-
59
-
60
-
61
-
62
-
63
-
64
-
 65
65 -
 66
66 -
 67
67 -
 68
68 -
 69
69 -
 70
70 -
 71
71 -
 72
72 -
 73
73 -
 74
74 -
 75
75 -
 76
76 -
 77
77 -
 78
78 -
 79
79 -
 80
80 -
 81
81 -
 82
82 -
 83
83 -
 84
84 -
 85
85 -
86
-
87
-
88
-
89
-
90
-
91
-
92
-
93
-
94
-
95
-
96
-
97
-
98
-
99
-
100
-
101
-
102
-
103
-
104
-
105
-
106
-
107
-
108
-
109
-
110
-
111
-
112
-
113
-
114
-
115
-
116
-
117
-
118
-
119
-
120
-
121
-
122
-
123
-
124
-
125
-
126
-
127
-
128
-
129
-
130
-
131
-
132
-
133
-
134
-
135
-
136
-
137
-
138
-
139
-
140
-
141
-
142
-
143
-
144
-
145
-
146
-
147
-
148
-
149
-
150
-
151
-
152
-
153
-
154
-
155
-
156
-
157
-
158
-
159
-
160
-
161
-
162
-
163
-
164
-
165
-
166
-
167
-
168
-
169
-
170
-
171
-
172
-
173
-
174
-
175
-
176
-
177
-
178
-
179
-
180
-
181
-
182
-
183
-
184
-
185
-
186
-
187
-
188
-
189
-
190
-
191
-
192
-
193
-
194
-
195
-
196
-
197
-
198
-
199
-
200
-
201
-
202
-
203
-
204
-
205
-
206
-
207
-
208
-
209
-
210
-
211
-
212
-
213
-
214
-
215
-
216
-
217
-
218
-
219
-
220
-
221
-
222
-
223
-
224
-
225
-
226
-
227
-
228
-
229
-
230
-
231
-
232
-
233
-
234
-
235
-
236
-
237
-
238
-
239
-
240
-
241
-
242
-
243
-
244
 |
 |
Each sector will take the lead on one of the leadership key
performance indicators with Healthcare leading ‘care’,
Lighting ‘energy efficiency’ and Consumer Lifestyle
‘materials’.
In addition, we defined a set of complementary
performance indicators to accelerate change and drive
performance, including the EcoVision4 parameters. This
new program is called EcoVision5 and we will report on
our progress going forward.
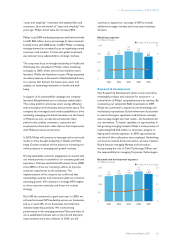
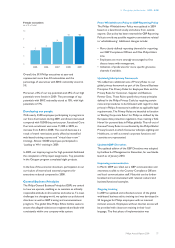
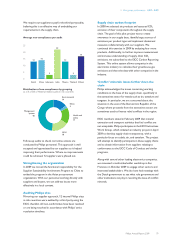
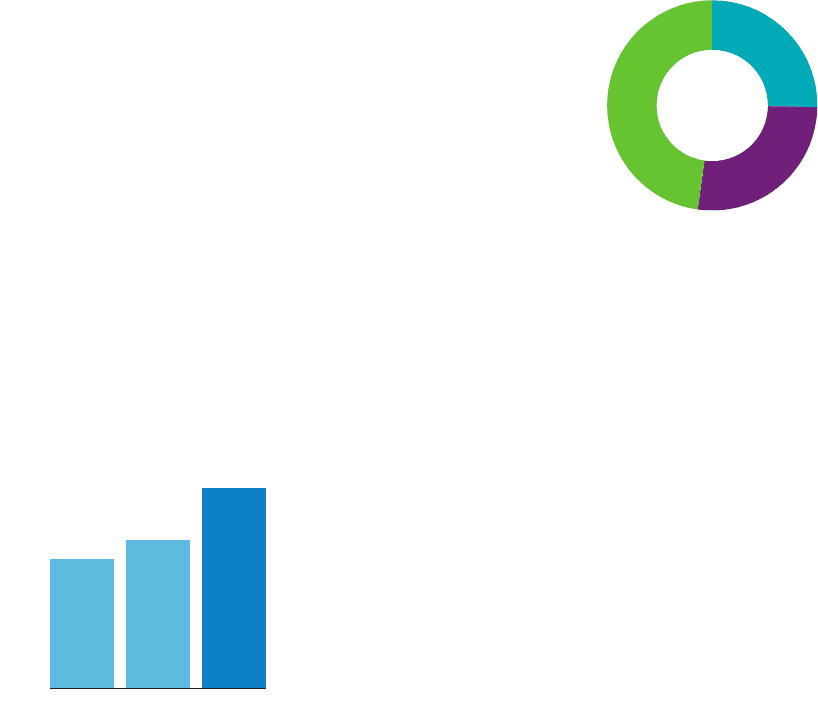
4.3.5 Green Product sales
Sales from Green Products increased 19% in 2009 to EUR
7.1 billion, contributing significantly to the total revenue
stream. As a percentage of the Group total, Green
Product sales rose to 30.6%, up from 22.6% in 2008,
meeting our 2012 target three years ahead of plan. As a
result, we have increased our target to 50% in 2015.
Sales of Green Products
as a % of total sales
35
30
25
20
15
10
5
0
20
2007
23
2008
31
2009
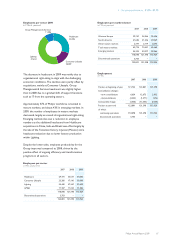
Consumer Lifestyle contributed most to the overall sales
increase with the introduction of 81 Green Products in
2009. Further progress was also achieved in the
Healthcare and Lighting sectors, where the share of
Green Product sales increased substantially with the
introduction of 15 and 700 new Green Products
respectively.
Overall, improvements have been predominantly realized
in energy efficiency, one of the Green Focal Areas in our
EcoDesign process.
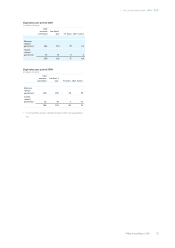
Green Product sales by sector
in millions of euros
Healthcare
1,791
Consumer Lifestyle
1,915
Lighting
3,393
4.3.6 Green Innovations
In 2009 Philips invested more than EUR 400 million in
Green Innovations – the Research & Development spend
related to the development of new generations of Green
Products and Green Technologies.
Philips Healthcare innovation projects consider all of the
Green Focal Areas and aim to reduce total life cycle
impact. In particular, the sector focuses on reducing
energy consumption, weight and dose.
Consumer Lifestyle’s investment in Green Innovations is
dedicated to the development of new Green Products,
focusing on further enhancing energy efficiency and on
closing material loops. Green Innovations at Consumer
Lifestyle increased significantly in 2009, and with visible
results. For example, 90% of our TV portfolio has been
awarded the EU Ecolabel after verification that the
products meet the EU’s high environmental and
performance standards.
The Lighting sector accounts for almost half of the total
spend on Green Innovations and also contributes to more
than 50% of Philips Green Product sales. The focus is on
developing new energy-efficient lighting solutions, further
enhancing current Green Products and driving toward
technological breakthroughs, such as solid-state lighting.
Within Corporate Technologies, Philips Research
invested approximately EUR 44 million, spread over
Green Innovation projects focused on innovations mainly
related to water, air, waste and energy.
4 Our group performance 4.3.4 - 4.3.7
Philips Annual Report 2009 75