Regions Bank 2010 Annual Report Download - page 100
Download and view the complete annual report
Please find page 100 of the 2010 Regions Bank annual report below. You can navigate through the pages in the report by either clicking on the pages listed below, or by using the keyword search tool below to find specific information within the annual report.-
 1
1 -
2
-
3
-
4
-
5
-
6
-
7
-
8
-
9
-
10
-
11
-
12
-
13
-
14
-
15
-
16
-
17
-
18
-
19
-
20
-
21
-
22
-
23
-
24
-
25
-
26
-
27
-
28
-
29
-
30
-
31
-
32
-
33
-
34
-
35
-
36
-
37
-
38
-
39
-
40
-
41
-
42
-
43
-
44
-
45
-
46
-
47
-
48
-
49
-
50
-
51
-
52
-
53
-
54
-
55
-
56
-
57
-
58
-
59
-
60
-
61
-
62
-
63
-
64
-
65
-
66
-
67
-
68
-
69
-
70
-
71
-
72
-
73
-
74
-
75
-
76
-
77
-
78
-
79
-
80
-
81
-
82
-
83
-
84
-
85
-
86
-
87
-
88
-
89
-
 90
90 -
 91
91 -
 92
92 -
 93
93 -
 94
94 -
 95
95 -
 96
96 -
 97
97 -
 98
98 -
 99
99 -
 100
100 -
 101
101 -
 102
102 -
 103
103 -
 104
104 -
 105
105 -
 106
106 -
 107
107 -
 108
108 -
 109
109 -
 110
110 -
111
-
112
-
113
-
114
-
115
-
116
-
117
-
118
-
119
-
120
-
121
-
122
-
123
-
124
-
125
-
126
-
127
-
128
-
129
-
130
-
131
-
132
-
133
-
134
-
135
-
136
-
137
-
138
-
139
-
140
-
141
-
142
-
143
-
144
-
145
-
146
-
147
-
148
-
149
-
150
-
151
-
152
-
153
-
154
-
155
-
156
-
157
-
158
-
159
-
160
-
161
-
162
-
163
-
164
-
165
-
166
-
167
-
168
-
169
-
170
-
171
-
172
-
173
-
174
-
175
-
176
-
177
-
178
-
179
-
180
-
181
-
182
-
183
-
184
-
185
-
186
-
187
-
188
-
189
-
190
-
191
-
192
-
193
-
194
-
195
-
196
-
197
-
198
-
199
-
200
-
201
-
202
-
203
-
204
-
205
-
206
-
207
-
208
-
209
-
210
-
211
-
212
-
213
-
214
-
215
-
216
-
217
-
218
-
219
-
220
-
221
-
222
-
223
-
224
-
225
-
226
-
227
-
228
-
229
-
230
-
231
-
232
-
233
-
234
-
235
-
236
 |
 |

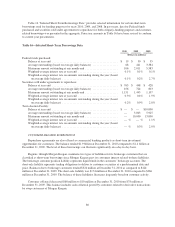
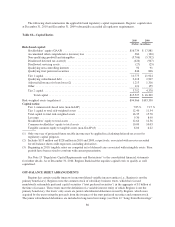
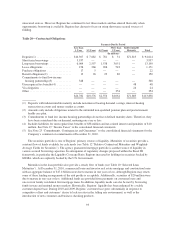
The following chart summarizes the applicable bank regulatory capital requirements. Regions’ capital ratios
at December 31, 2010 and December 31, 2009 substantially exceeded all regulatory requirements.
Table 18—Capital Ratios
2010 2009
(Dollars in millions)
Risk-based capital:
Stockholders’ equity (GAAP) ............................................. $16,734 $ 17,881
Accumulated other comprehensive (income) loss ............................. 260 (130)
Non-qualifying goodwill and intangibles .................................... (5,706) (5,792)
Disallowed deferred tax assets(1) .......................................... (424) (947)
Disallowed servicing assets ............................................... (27) (25)
Qualifying non-controlling interests ........................................ 92 91
Qualifying trust preferred securities ........................................ 846 846
Tier 1 capital .......................................................... 11,775 11,924
Qualifying subordinated debt ............................................. 2,418 2,907
Adjusted allowance for loan losses(2) ...................................... 1,213 1,316
Other ................................................................ 121 155
Tier 2 capital .......................................................... 3,752 4,378
Total capital ....................................................... $15,527 $ 16,302
Risk-weighted assets (regulatory) .............................................. $94,966 $103,330
Capital ratios:
Tier 1 common risk-based ratio (non-GAAP) ................................ 7.85 % 7.15 %
Tier 1 capital to total risk-weighted assets ................................... 12.40 11.54
Total capital to total risk-weighted assets .................................... 16.35 15.78
Leverage ............................................................. 9.30 8.90
Stockholders’ equity to total assets ......................................... 12.64 12.56
Common stockholders’ equity to total assets ................................. 10.09 10.03
Tangible common equity to tangible assets (non-GAAP)(3) ..................... 6.04 6.22
(1) Only one year of projected future taxable income may be applied in calculating deferred tax assets for
regulatory capital purposes.
(2) Includes $119 million and $128 million in 2010 and 2009, respectively, associated with reserves recorded
for off-balance sheet credit exposures, including derivatives.
(3) Beginning in 2010, tangible ratios are computed net of deferred taxes associated with intangible assets. Prior
periods have been revised to conform with current presentation.
See Note 13 “Regulatory Capital Requirements and Restrictions” to the consolidated financial statements
for further details. As of December 31, 2010, Regions Bank had the requisite capital levels to qualify as well
capitalized.
OFF-BALANCE SHEET ARRANGEMENTS
Regions has certain variable interests in unconsolidated variable interest entities (i.e., Regions is not the
primary beneficiary). Regions owns the common stock of subsidiary business trusts, which have issued
mandatorily redeemable preferred capital securities (“trust preferred securities”) in the aggregate of $1 billion at
the time of issuance. These trusts meet the definition of a variable interest entity of which Regions is not the
primary beneficiary; the trusts’ only assets are junior subordinated debentures issued by Regions, which were
acquired by the trusts using the proceeds from the issuance of the trust preferred securities and common stock.
The junior subordinated debentures are included in long-term borrowings (see Note 12 “Long-Term Borrowings”
86