Regions Bank 2010 Annual Report Download - page 123
Download and view the complete annual report
Please find page 123 of the 2010 Regions Bank annual report below. You can navigate through the pages in the report by either clicking on the pages listed below, or by using the keyword search tool below to find specific information within the annual report.-
 1
1 -
2
-
3
-
4
-
5
-
6
-
7
-
8
-
9
-
10
-
11
-
12
-
13
-
14
-
15
-
16
-
17
-
18
-
19
-
20
-
21
-
22
-
23
-
24
-
25
-
26
-
27
-
28
-
29
-
30
-
31
-
32
-
33
-
34
-
35
-
36
-
37
-
38
-
39
-
40
-
41
-
42
-
43
-
44
-
45
-
46
-
47
-
48
-
49
-
50
-
51
-
52
-
53
-
54
-
55
-
56
-
57
-
58
-
59
-
60
-
61
-
62
-
63
-
64
-
65
-
66
-
67
-
68
-
69
-
70
-
71
-
72
-
73
-
74
-
75
-
76
-
77
-
78
-
79
-
80
-
81
-
82
-
83
-
84
-
85
-
86
-
87
-
88
-
89
-
90
-
91
-
92
-
93
-
94
-
95
-
96
-
97
-
98
-
99
-
100
-
101
-
102
-
103
-
104
-
105
-
106
-
107
-
108
-
109
-
110
-
111
-
112
-
 113
113 -
 114
114 -
 115
115 -
 116
116 -
 117
117 -
 118
118 -
 119
119 -
 120
120 -
 121
121 -
 122
122 -
 123
123 -
 124
124 -
 125
125 -
 126
126 -
 127
127 -
 128
128 -
 129
129 -
 130
130 -
 131
131 -
 132
132 -
 133
133 -
134
-
135
-
136
-
137
-
138
-
139
-
140
-
141
-
142
-
143
-
144
-
145
-
146
-
147
-
148
-
149
-
150
-
151
-
152
-
153
-
154
-
155
-
156
-
157
-
158
-
159
-
160
-
161
-
162
-
163
-
164
-
165
-
166
-
167
-
168
-
169
-
170
-
171
-
172
-
173
-
174
-
175
-
176
-
177
-
178
-
179
-
180
-
181
-
182
-
183
-
184
-
185
-
186
-
187
-
188
-
189
-
190
-
191
-
192
-
193
-
194
-
195
-
196
-
197
-
198
-
199
-
200
-
201
-
202
-
203
-
204
-
205
-
206
-
207
-
208
-
209
-
210
-
211
-
212
-
213
-
214
-
215
-
216
-
217
-
218
-
219
-
220
-
221
-
222
-
223
-
224
-
225
-
226
-
227
-
228
-
229
-
230
-
231
-
232
-
233
-
234
-
235
-
236
 |
 |

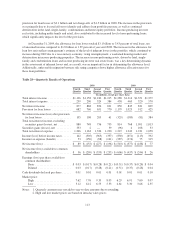
2007 2006
(Dollars in millions)
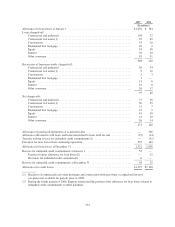
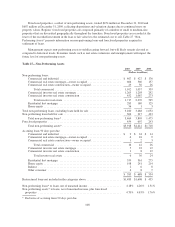
Non-performing loans:
Commercial and industrial .................................................... $ 92 $ 57
Commercial real estate(1) ..................................................... 263 128
Construction(1) ............................................................. 310 57
Residential first mortgage ..................................................... 72 54
Home equity ............................................................... 7 10
Total non-performing loans ........................................................ 744 306
Foreclosed properties ............................................................ 120 73
Total non-performing assets* .................................................. $864 $379
Non-performing loans* to loans, net of unearned income ................................ 0.78% 0.32%
Non-performing assets* excluding loans held for sale, to loans, net of unearned income and
foreclosed properties ........................................................... 0.90% 0.40%
Non-performing assets* to loans, net of unearned income and foreclosed properties ........... 0.90% 0.40%
Accruing loans 90 days past due:
Commercial and industrial .................................................... $ 12 $ 10
Commercial real estate(1) ..................................................... 12 26
Construction(1) ............................................................. 19 15
Residential first mortgage ..................................................... 155 44
Home equity ............................................................... 147 41
Indirect ................................................................... 6 3
Other consumer ............................................................. 6 5
$ 357 $ 144
* Exclusive of accruing loans 90 days past due
(1) Breakout of commercial real estate mortgage and construction between owner occupied and investor
categories not available for periods prior to 2008.
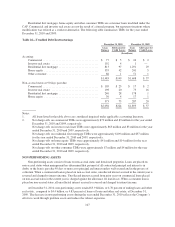
Loans past due 90 days or more and still accruing totaled $585 million as of year-end 2010, a decrease of
$103 million from year-end 2009 levels, reflecting improvement across all loan categories.
At December 31, 2010 and December 31, 2009, Regions had approximately $800 million and $1.2 billion,
respectively, of potential problem commercial and investor real estate loans that were not included in non-accrual
loans, but for which management had concerns as to the ability of such borrowers to comply with their present
loan repayment terms.
FINANCIAL DISCLOSURE AND INTERNAL CONTROLS
Regions has always maintained internal controls over financial reporting, which generally include those
controls relating to the preparation of the consolidated financial statements in conformity with accounting
principles generally accepted in the U.S. Regions’ process for evaluating internal controls over financial
reporting starts with understanding the risks facing each of its functions and areas; how those risks are controlled
or mitigated; and how management monitors those controls to ensure that they are in place and effective. These
risks, control procedures and monitoring tools are documented in a standard format. This format not only
documents the internal control structures over all significant accounts, but also places responsibility on
management for establishing feedback mechanisms to ensure that controls are effective. These monitoring
procedures are also part of management’s testing of internal controls. At least quarterly, each area updates and
assesses the adequacy of its documented internal controls. If changes are necessary, updates are made more
frequently.
109