Regions Bank 2010 Annual Report Download - page 92
Download and view the complete annual report
Please find page 92 of the 2010 Regions Bank annual report below. You can navigate through the pages in the report by either clicking on the pages listed below, or by using the keyword search tool below to find specific information within the annual report.-
 1
1 -
2
-
3
-
4
-
5
-
6
-
7
-
8
-
9
-
10
-
11
-
12
-
13
-
14
-
15
-
16
-
17
-
18
-
19
-
20
-
21
-
22
-
23
-
24
-
25
-
26
-
27
-
28
-
29
-
30
-
31
-
32
-
33
-
34
-
35
-
36
-
37
-
38
-
39
-
40
-
41
-
42
-
43
-
44
-
45
-
46
-
47
-
48
-
49
-
50
-
51
-
52
-
53
-
54
-
55
-
56
-
57
-
58
-
59
-
60
-
61
-
62
-
63
-
64
-
65
-
66
-
67
-
68
-
69
-
70
-
71
-
72
-
73
-
74
-
75
-
76
-
77
-
78
-
79
-
80
-
81
-
 82
82 -
 83
83 -
 84
84 -
 85
85 -
 86
86 -
 87
87 -
 88
88 -
 89
89 -
 90
90 -
 91
91 -
 92
92 -
 93
93 -
 94
94 -
 95
95 -
 96
96 -
 97
97 -
 98
98 -
 99
99 -
 100
100 -
 101
101 -
 102
102 -
103
-
104
-
105
-
106
-
107
-
108
-
109
-
110
-
111
-
112
-
113
-
114
-
115
-
116
-
117
-
118
-
119
-
120
-
121
-
122
-
123
-
124
-
125
-
126
-
127
-
128
-
129
-
130
-
131
-
132
-
133
-
134
-
135
-
136
-
137
-
138
-
139
-
140
-
141
-
142
-
143
-
144
-
145
-
146
-
147
-
148
-
149
-
150
-
151
-
152
-
153
-
154
-
155
-
156
-
157
-
158
-
159
-
160
-
161
-
162
-
163
-
164
-
165
-
166
-
167
-
168
-
169
-
170
-
171
-
172
-
173
-
174
-
175
-
176
-
177
-
178
-
179
-
180
-
181
-
182
-
183
-
184
-
185
-
186
-
187
-
188
-
189
-
190
-
191
-
192
-
193
-
194
-
195
-
196
-
197
-
198
-
199
-
200
-
201
-
202
-
203
-
204
-
205
-
206
-
207
-
208
-
209
-
210
-
211
-
212
-
213
-
214
-
215
-
216
-
217
-
218
-
219
-
220
-
221
-
222
-
223
-
224
-
225
-
226
-
227
-
228
-
229
-
230
-
231
-
232
-
233
-
234
-
235
-
236
 |
 |

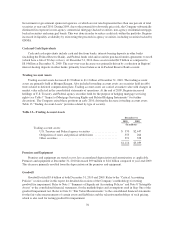
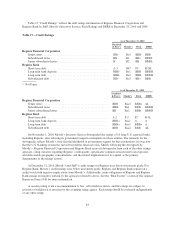
additional liquidity in the market, pricing rationale largely returned, enabling Regions to increase its low-cost
customer deposits and reduce its total deposit costs from 1.35 percent in 2009 to 0.78 percent in 2010.
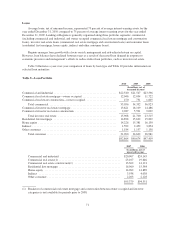
Table 14—Deposits
2010 2009 2008
(In millions)
Non-interest-bearing demand .......................................... $25,733 $23,204 $18,457
Savings accounts ................................................... 4,668 4,073 3,663
Interest-bearing transaction accounts .................................... 13,423 15,791 15,022
Money market accounts—domestic ..................................... 27,420 23,291 19,471
Money market accounts—foreign ...................................... 569 766 1,812
Low-cost deposits ............................................... 71,813 67,125 58,425
Time deposits ...................................................... 22,784 31,468 32,369
Customer deposits .............................................. 94,597 98,593 90,794
Corporate Treasury deposits
Time deposits .................................................. 17 87 110
Total deposits ...................................................... $94,614 $98,680 $90,904
Regions elected to exit the Federal Deposit Insurance Corporation’s (“FDIC”) Transaction Account
Guarantee (“TAG”) program on July 1, 2010. The TAG program was a component of the Temporary Liquidity
Guarantee Program, whereby the FDIC guarantees all funds held at participating institutions beyond the
$250,000 deposit insurance limit in qualifying transaction accounts. Regions’ decision to exit the program did
not have a significant impact on liquidity. When the Dodd-Frank Act was enacted in July 2010, it permanently
increased the FDIC coverage limit to $250,000. Also as a result of the Dodd-Frank Act, effective as of
December 31, 2010, unlimited coverage for non-interest bearing demand transaction accounts will be provided
until January 1, 2013.
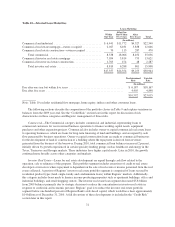
Within customer deposits, non-interest-bearing deposits increased $2.5 billion to $25.7 billion, driven by an
increase in non-interest bearing deposits from commercial and small businesses and a mix shift from interest-
bearing transaction accounts which decreased 15 percent to $13.4 billion. Non-interest-bearing deposits
accounted for approximately 27 percent of total deposits at year-end 2010 as compared to 24 percent at year-end
2009. Savings balances increased $595 million to $4.7 billion, generally reflecting growing savings trends,
spurred by economic uncertainty.
Domestic money market products, which exclude foreign money market accounts, are one of Regions’ most
significant funding sources. These balances increased 18 percent in 2010 to $27.4 billion or 29 percent of total
deposits, compared to 24 percent of total deposits in 2009 and 21 percent of total deposits in 2008. Money market
accounts steadily increased throughout 2010. Also, foreign money market accounts decreased $197 million, or 26
percent, to $569 million in 2010.
Included in customer time deposits are certificates of deposit and individual retirement accounts. The
balance of customer time deposits decreased 28 percent in 2010 to $22.8 billion compared to $31.5 billion in
2009. The decrease was primarily due to maturities with minimal reinvestment by customers as a result of a
decline in rates offered on these products. Customer time deposits accounted for 24 percent of total deposits in
2010 compared to 32 percent in 2009.
Consistent with 2009, total treasury deposits, which are used mainly for overnight funding purposes,
remained at low levels in 2010 as the Company continued to utilize customer-based funding and other sources.
The Company’s choice of overnight funding sources is dependent on the Company’s particular funding needs
and the relative attractiveness of each source.
78